Today Governor Jack Markell and Secretary of Education Mark Murphy held the first of what will be annual reviews of academic progress with Delaware educators. The review, conducted via a teleconference town hall, provided the opportunity for the Governor and the Secretary to share data regarding the 2011-12 school year with teachers, principals, superintendents and school board members, and to acknowledge the work they are doing to implement changes for the benefit of students. It also provided the opportunity to recognize the important role that data can play in instruction in the classroom and in policy making at a state level.
Two years ago, Delaware began using the Delaware Comprehensive Assessment System (DCAS) – a statewide assessment that, in addition to testing student proficiency at the end of the school year, provides a tool by which teachers can measure student progress throughout the year. While year end results are clearly important to our work, the real benefit of data is realized when it is used daily in our classrooms.
This year, preliminary DCAS results show statewide student gains in reading and math in every grade band, as well as a narrowing of many achievement gaps.
“The commitment and hard work of our state’s great teachers and principals, coupled with their use of data to drive better instruction is having a positive effect. Change is never easy, but these results show that progress is possible when we focus on what matters most, the children in the classroom and the teachers and principals that help them learn. If we continue this focus, our children will be ready to compete with kids from around the world,” Markell said.
Murphy also credited educators for their work.
“Our teachers, building administrators and district and charter leadership have done incredible work in the past year meeting the needs of their students,” Murphy said. “The extra supports and assistance as well as a realigned focus provided through the state’s Race to the Top plan aided their work, but first and foremost, the credit must go to our educators.
“This is solid progress, and our students and educators should be celebrated for their hard work. It is paying off,” he said.
The spring testing window closed June 1. The following represents the preliminary statewide results. Final state, district- and school-level results will be released in July after student enrollment and other business rules are applied, and all data is fully quality-controlled (including review of all exceptions).
This year, DDOE offered two spring assessment opportunities – the first opportunity, which all students completed, and an optional second opportunity, which allowed schools, teachers and students to focus on areas needing more work.
The data below indicates the score on the last test a student took, meaning if the student tested in both opportunities, it reflects the final test score regardless of which one was better. The accountability data to be released in July will look at the best of either and thus the data will be higher.
Highlights of the statewide results include:
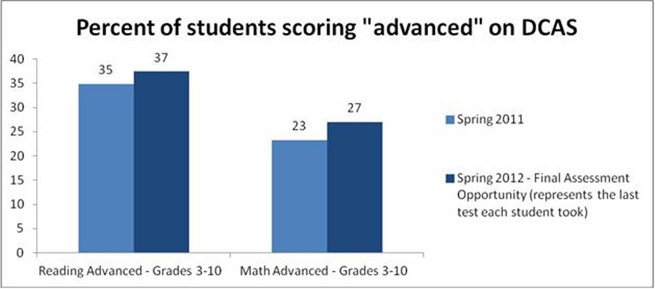
The results show progress as well as remaining challenges:
Progress
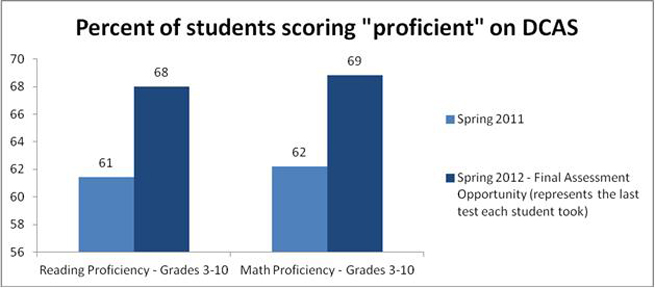
- Overall reading and math proficiency across grades 3-10:
- 61% of students were proficient in reading (DCAS 3 or 4) last spring, as compared to 68% this year for the final assessment opportunity
- 62% of students were proficient in math (DCAS 3 or 4) last spring, as compared to 69% this year for the final assessment opportunity
- Overall reading and math “advanced” across grades 3-10:
- 35% of students were advanced in reading (DCAS 4) last spring, as compared to 37% this year for the final assessment opportunity
- 23% of students were advanced in math (DCAS 4) last spring, as compared to 27% this year for the final assessment opportunity
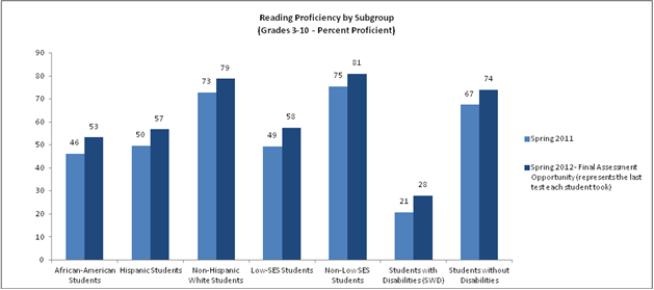
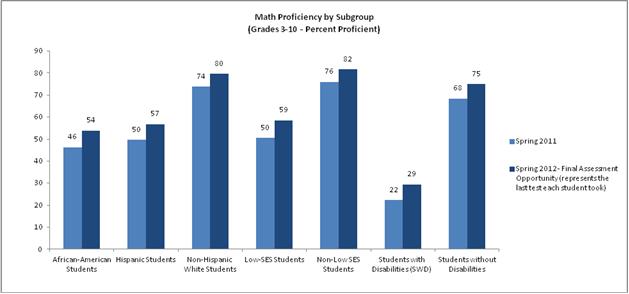
- Achievement gaps
The increases in proficiency occurred across all major subgroups. Proficiency of underrepresented subgroups often increased more than that of their counterparts, representing a narrowing of achievement gaps.
Challenges
- Students with disabilities
- While the “students with disabilities” subgroup showed increases in proficiency across testing opportunities, it was the only major subgroup to not show a greater increase in reading and math proficiency than its reference group (from last year to the final assessment opportunity this year).
- Social Studies and Science Proficiency
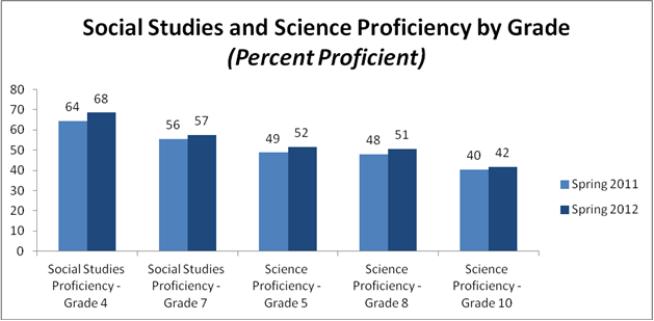
- Social Studies proficiency was 68% and 57% in grades 4 and 7, respectively; that represents a 2-4 percentage point increase from the previous year but greater progress is needed
- Science proficiency was 52%, 51% and 42% in grades 5, 8 and 10, respectively; that represents a 1-3 percentage point increase from the previous year but greater progress is needed
In recent months, the state conducted more than 40 focus groups with hundreds of educators across the state. Individuals in the field attributed the gains they were seeing in their schools to core components of Delaware’s education plan, many of which are funded by Race to the Top:
- Professional Learning Communities – designated shared planning time for teachers to discuss curriculum and dig into student data to inform their instruction
- New Assessment – computer-adaptive test that provides immediate feedback and multiple testing windows
- Leadership Coaching and Development Coaches – targeted supports for school leaders to increase administrators’ focus on instructional leadership
Districts and charters have also credited their local-specific initiatives with helping to drive gains. Examples of initiatives that districts have credited with early results are:
- More rigorous curriculum, such as Brandywine School District’s Singapore Math
- Small student learning communities, such as Seaford School District’s New Tech Academy at the High School
- Targeted student interventions, such as Smyrna School District’s acceleration programs
State officials will spend the coming months digging deeper into the data to analyze the gains and contributing factors. They also will look at remaining challenges and potential causes at the state and local level, as well as opportunities to strengthen implementation statewide.
This summer, DDOE will share district-specific dashboards and synopses of progress during the 2011-12 school year.
