Delaware Graduation Rates at Highest Level in a Decade

African American students, Hispanic students, and students with disabilities recorded the highest graduation rates on record

WILMINGTON, Del. – Delaware high school students are graduating at their highest levels in at least a decade, according to the 2019 graduation data released on Wednesday by Governor John Carney and Dr. Susan Bunting, Secretary of the Delaware Department of Education.

The statewide graduation rate for the Class of 2019 was 88.27 percent, an increase from the Class of 2018, which had a graduation rate of 86.69 percent. Class of 2020 data will not be available until 2021.

African American students, Hispanic students, and students with disabilities also recorded the highest graduation rates since the State of Delaware began tracking additional data in 2010, according to the results released on Wednesday.

Click here for the latest graduation data from the Delaware Department of Education.

“More Delaware students are graduating high school ready for college or a career,” said Governor Carney. “That has been a focus of Secretary Bunting and her team at the Department of Education since we took office in 2017 – and it’s great news for the future of our state. The data we’re releasing today shows that Delaware’s progress is broad, and that Delaware’s educators are committed to helping all of their students succeed. That work continues. We will remain committed to supporting our educators and students, and continuing to invest in public education. Nothing is more important to the long-term success of our state.”

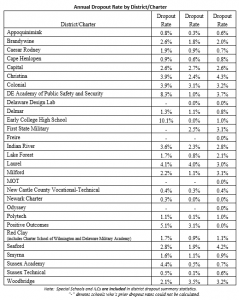
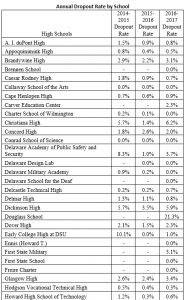
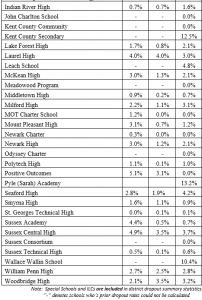
Due to COVID-19 school building closures, data collection for the state’s dropout rate typically released with the graduation rate data has been delayed. That report will be released in the fall.

“This data is important because it is more than a set of numbers in a report. It confirms that more Delaware high school students are leaving high school with a diploma, an important milestone in furthering their education and career. I congratulate the educators, families and students whose hard work has led to this progress,” said Secretary Bunting. “However, we still have work to do. Our subgroup data shows that some student groups are not graduating at the same rate as their peers. We must provide additional targeted supports to ensure every child is leaving high school with the diploma that will open the door to future success.”

This year’s rate is the highest since the state changed how it calculates graduation rates in 2010-11.

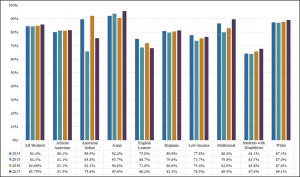
The Class of 2019 graduation rate was 85.02 percent for Hispanic students, 86.37 percent for African American students and 90.7 percent for white students.

The Class of 2019 four-year graduation rate was 71.59 percent for students with disabilities and 75.25 percent for English learner students.

By county, New Castle had the highest graduation rate at 90.5 percent followed by Kent at 87.38 percent and Sussex at 87.06 percent.

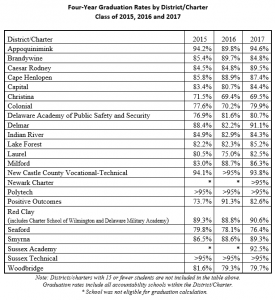
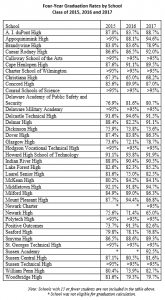
Find more subgroup data as well as graduation rates by high school in the full report from the Delaware Department of Education.

###


Delaware high school graduation rate up

Delaware’s high school graduation rate hit a record high in 2017. The state’s dropout rate also slightly increased.

annual Delaware Department of Education reports, which will be presented to the State Board of Education tonight, show an overall graduation rate of 85.75 percent in 2017. The graduation rate for several student subgroups – African American, Asian, Hispanic, low-income, multiracial, white and students with disabilities – also are up from 2016. The rates for two other subgroups – American Indian and English learner – declined.

Meanwhile the dropout rate saw a slight increase – 700 of the 40,884 students enrolled in grades 9-12 dropped out for a rate of 1.7 percent, slightly up from the 2016 rate of 1.4 percent.

Across our state, teachers, counselors, school leaders and community partners are collaborating with families to support their students, particularly those who are at risk for leaving school or falling behind on credit accrual. Their collective work is the reason more of our students are graduating,” Secretary of Education Susan Bunting said. “Still none of us is satisfied. We will continue to increase graduation rates and decrease the dropout rate because behind these numbers are real students who need diplomas to be ready to succeed in postsecondary education and/or careers.”


Graduation rate

with a regular high school diploma within four years.

While the annual dropout rate provides information about one particular school year and all students enrolled in high school in that year, the graduation rate provides information about a particular group of students followed over the course of high school. It looks at all students who started high school at the 9th grade and how many graduated within four years. For this year’s data, that means students who started 9th grade in the 2013/14 school year.

This year’s rate is the highest since the state changed how it calculates graduation rates in 2010-11.

Last year, out of 10,203 students in the Class of 2017, 8,749 students graduated with a regular diploma, a rate of 85.75 percent. The state also looks at five- and six-year graduation rates. The graduation rate for the Class of 2015 was 84.4 percent at the end of four years, 85.6 percent at the end of five years and 85.7 percent at the end of six years.

Four-year graduation rate trend data, including subgroup and district/school information, is shown below.


Four-Year Graduation Rates by District/Charter
Class of 2015, 2016 and 2017


Dropout rate

The annual dropout rate is calculated from grades 9 to 12, as prescribed by the National Center for Educational Statistics (NCES), which provides data to the federal reporting system. The rate represents the total number of students (grades 9-12) who dropped out in a single year, divided by the total enrollment of the same school year. Data also is collected from private schools and families who homeschool their children. That information is only used to verify whether students transferred from public to private and home schools.

The annual report also looks at dropouts by student demographic. Statewide in the 2016-2017 school year, of the 700 who dropped out, 281 were African American, 258 were white/other and 161 were Hispanic.  Looking at the total student enrollment by demographics for 2016-17, 2.7 percent of Hispanic, 2.2 percent of black and 1.2 percent of white/other students dropped out.

The majority of the 700 dropouts were male (418). The largest number were enrolled in the 10th grade (246). Students cited academic, personal and economic reasons for why they left school.

The state report provides analysis based on demographics and geographic breakdowns, including by county and districts/charter schools. For 2016-17, Kent had the lowest percentage of dropouts (1.5 percent). New Castle’s rate was 1.6 percent while Sussex’s rate was 2.2 percent.


The report also looks at those students who live in the 19801 and 19802 zip codes of Wilmington. Of the 700 dropouts, 77 lived in those zip codes.


Media Contact: Alison May, alison.may@doe.k12.de.us, 302-735-4006