The Delaware Department of Education on Thursday released the 2019 statewide student assessment results.
Statewide, 53 percent of students in grades 3 to 8 scored at the proficient level or higher this year in the Smarter English language arts (ELA) assessment, compared to 54 percent in 2018. For mathematics, 44 percent of students in grades 3 to 8 scored at the proficient level or higher, no change from the 2018 results. At the high school level, students took the SAT with the results relatively unchanged.
Because Delaware transitioned this year to new science and social studies assessments, state officials will spend the fall setting cut scores to determine which scores are proficient on the new tests. Results will be released this winter. Results for the state’s alternate assessment, administered to those students with significant cognitive disabilities, were released today as well. Those results also were relatively unchanged.
Educators already received their students’ scores — Smarter results, for example, are available to teachers three weeks after their students complete the test. Families will receive score reports with their children’s results via U.S. mail beginning next week. Family guides and other resources also are available online.
For more information on state assessment results, visit the Delaware Report Card site and see the 2019 assessment presentation.
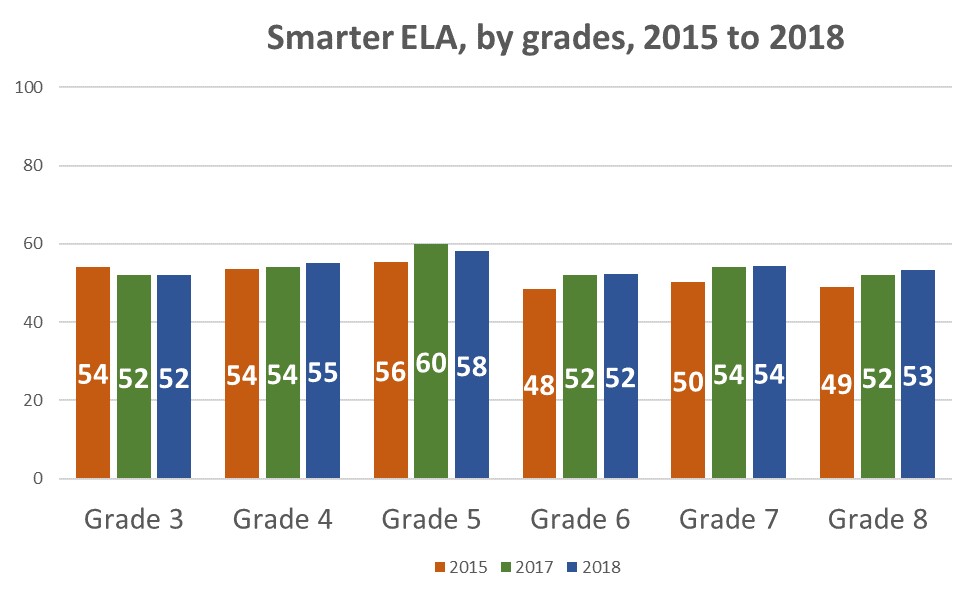
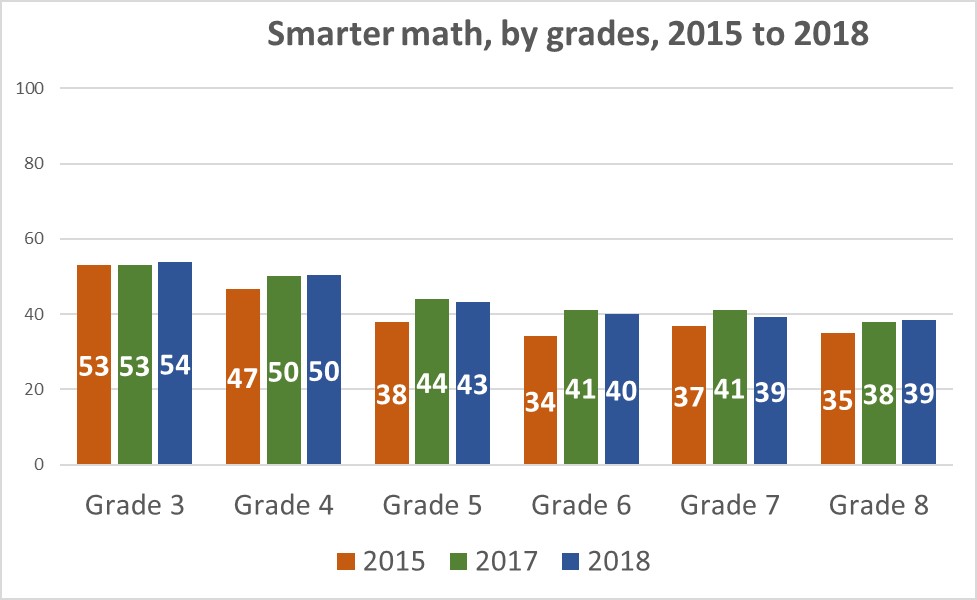
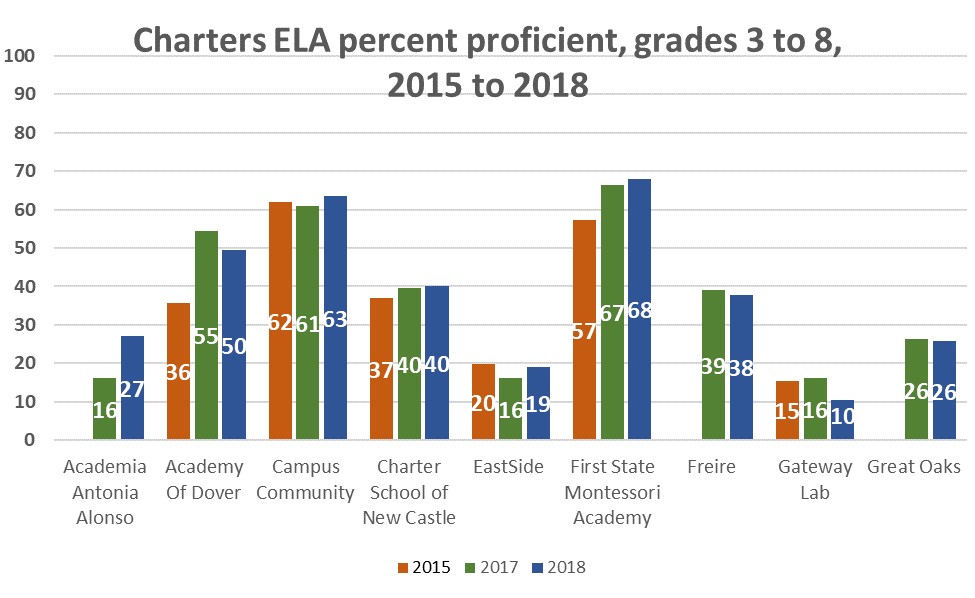
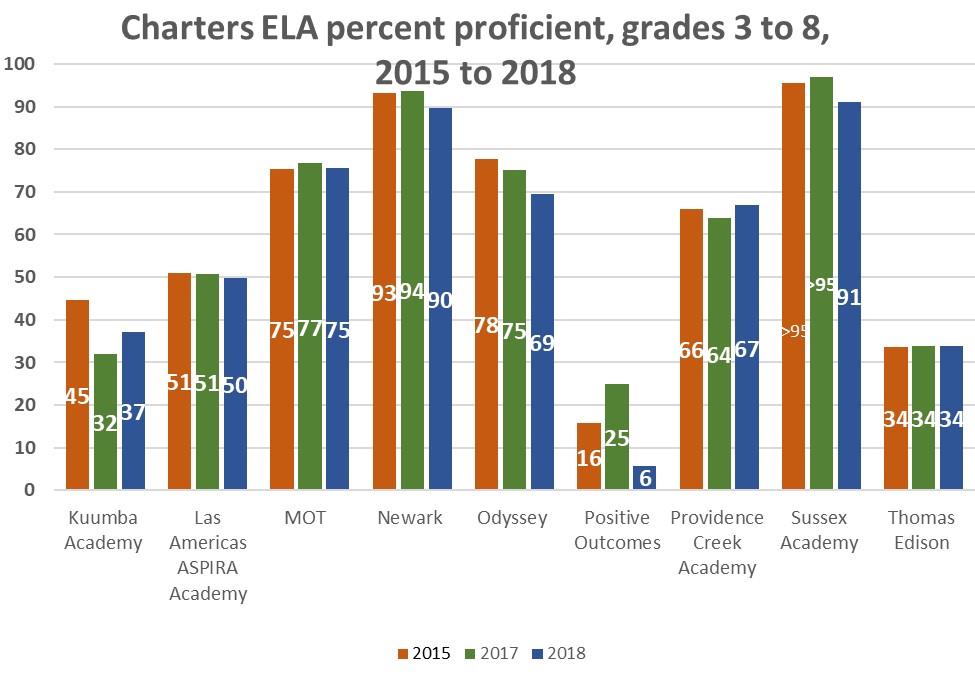
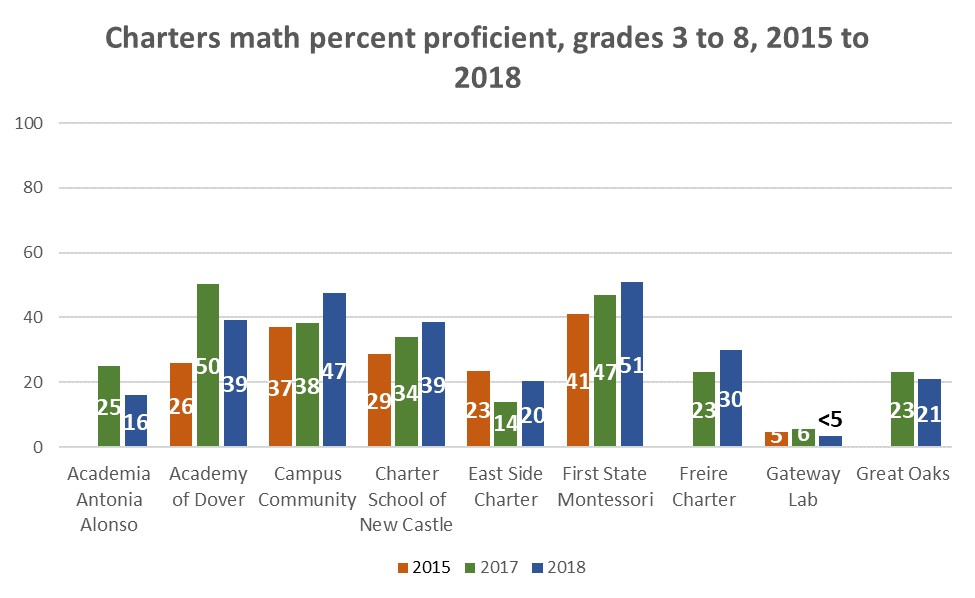
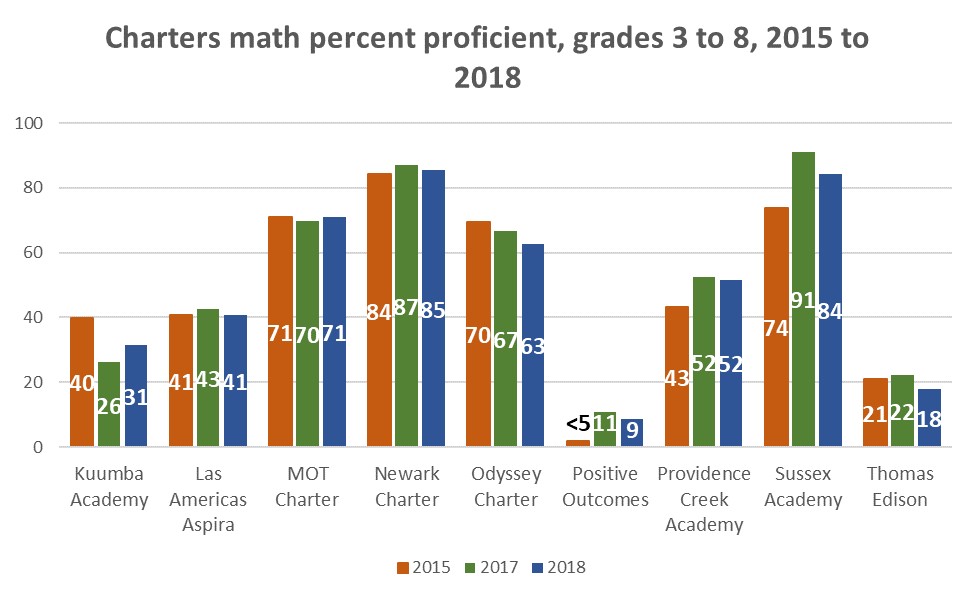
Smarter Assessment (ELA/mathematics)
Nationwide, states administering the Smarter assessment have seen similar trends to Delaware – slow growth at the state level with larger gains at some school levels.
Delaware did see slight gains in some subgroups statewide between 2018 and 2019, with English learners and students with disabilities averages increasing by one percentage point each in ELA and one percentage point in math for both students with disabilities and Hispanic students.
Secretary of Education Susan Bunting thanked students and educators for their hard work. She also committed to continue to provide supports from the state.
“We must focus our time and resources on promoting early diagnosis and intervention, using a range of assessments throughout the year and training educators on how to use the data available to them to effect change in curriculum and instruction,” she said. “We also must provide technical assistance and other support to our schools and districts as they select local curricula so all children have access to high quality materials and assessments.”
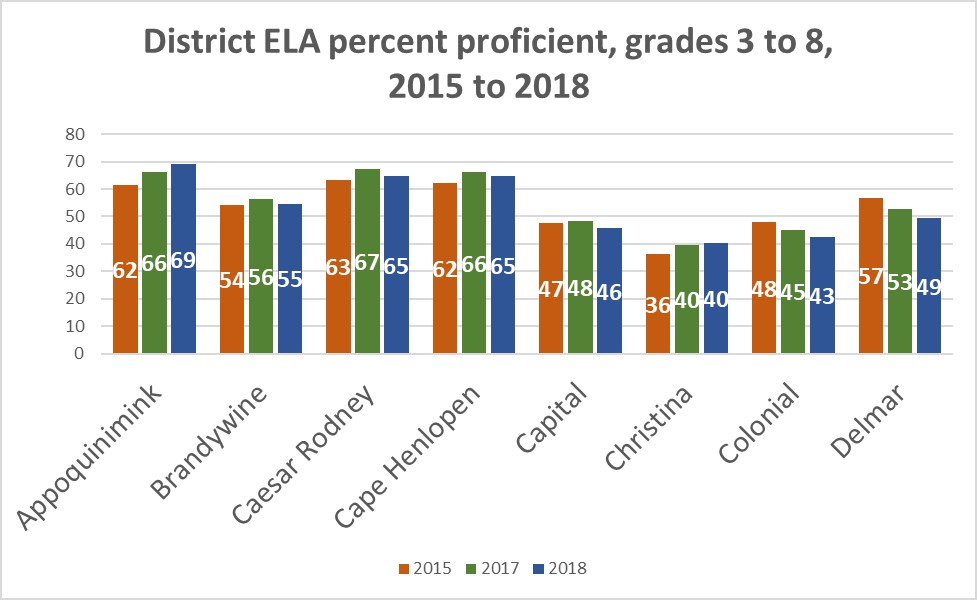
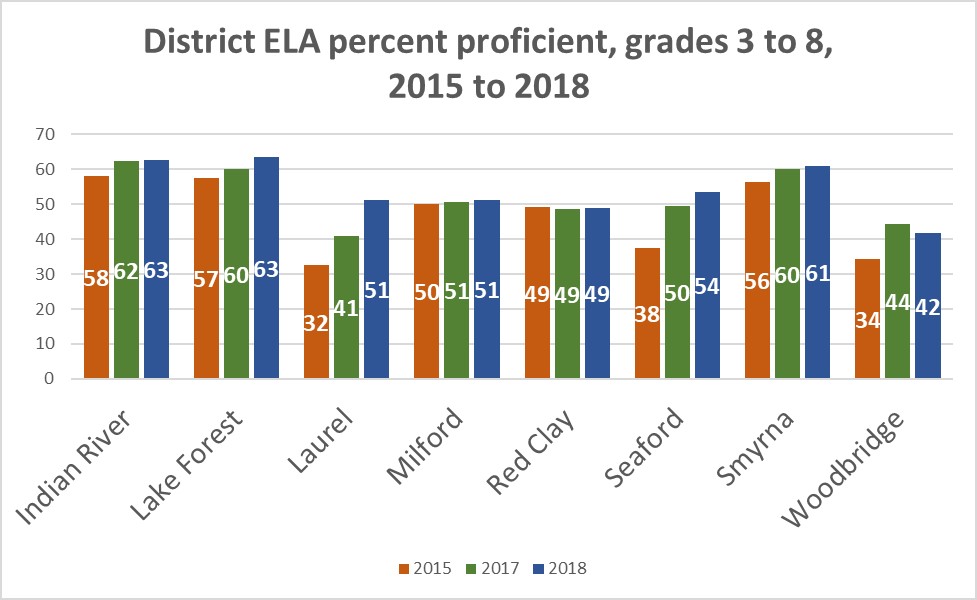
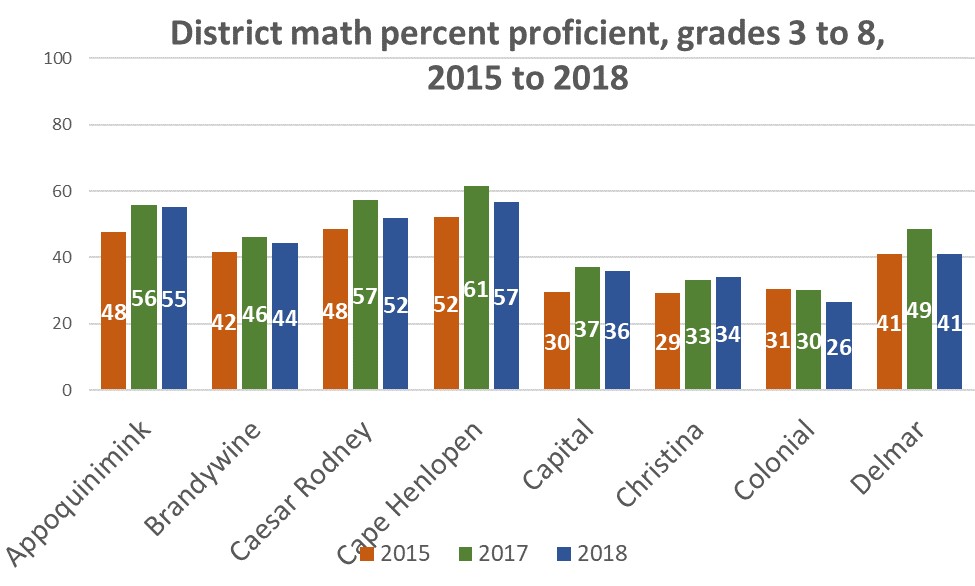
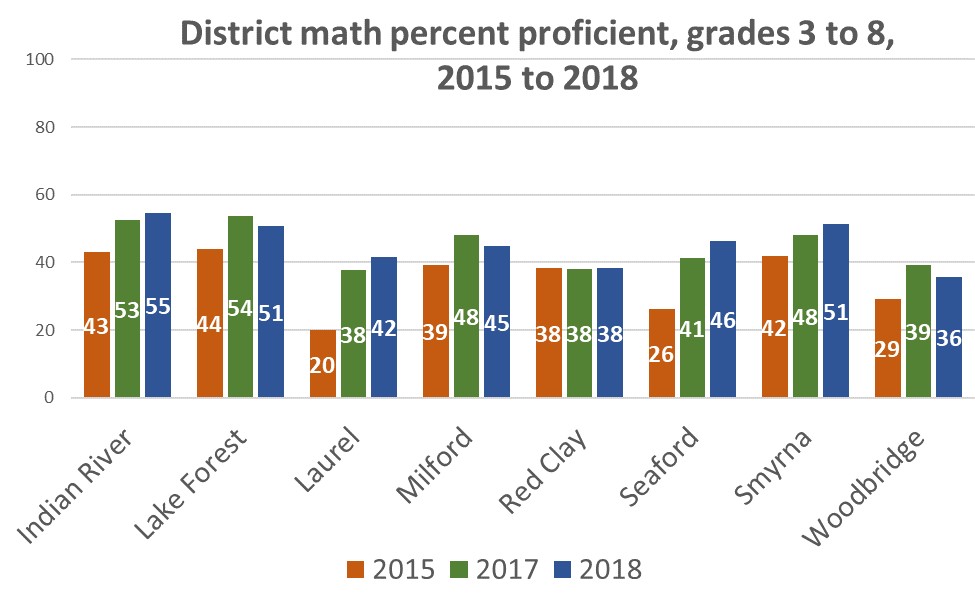
Bunting also pointed to bright spots across the state, such as in Seaford School District, which has seen steady growth in both ELA and mathematics scores since 2015, the first year the state administered the Smarter assessment. For ELA, 56 percent of students scored at the proficient level or higher, above the state average and up 2 percentage points from last year. In 2015, only 38 percent of Seaford students were proficient. Math scores also are continuing to climb: This year 48 percent of students scored at proficient or higher, above the state average and 2 percentage points higher than in 2018. It is a 20-point gain from 2015.
Seaford’s Frederick Douglass Elementary particularly has shown strong growth. For ELA, 42 percent of students were proficient in 2015. The number has consistently improved since then, reaching 67 percent of students this year. In 2015, only 7 percent of the school’s English learners were proficient in ELA; 60 percent were this year. Other subgroups also showed strong ELA growth: the percent proficient went from 39 percent to 64 percent for low-income students, and 7 percent to 47 percent for students with disabilities.
Douglass’ math scores also have increased steadily, moving from 35 percent to 69 percent for all students between 2015 and 2019. English learner scores went from 7 percent to 70 percent proficient, students with disabilities went from 14 percent to 41 percent, low-income went from 30 percent to 66 percent, and Hispanic students went from 37 to 76 percent.
“When asked to explain our success we are able to point to simple addition,” Seaford Superintendent David Perrington said. “The district has worked hard at bringing together a number of dynamics that are essential for student achievement. These include a supportive school board, a vision-driven district office staff, a strong building leadership, a committed teaching staff, an engaged student body, and a caring school community.
“At the beginning of the school year we discussed the concept ‘Push Don’t Pity.’ This model is grounded in the belief of high expectations for all students,” he said. “It requires us as educators to accept the responsibility of each student’s learning experience and each student to believe they have the capacity to succeed. When added successfully together we have a sum of increasing student achievement.”
Lake Forest also saw some strong gains, particularly among subgroups in mathematics in several of its elementary schools. Lake Forest East, for example, saw gains between 2018 and 2019 of 39 percentage points for Hispanic students, 39 percentage points for English learners, 20 percentage points for low-income students and 14 percentage points for African American students. The gain was 12 percentage points for all students.
At Lake Forest North, the 2018 to 2019 scores show gains of 23 percentage points for low-income students, 17 percentage points for English learners, 8 percentage points for African American students, 7 percentage points for Hispanic students and 4 percentage points for all students.
“The Lake Forest School District attributes our success to using the standards to refine curriculum and lesson plans, analyzing formative and summative data during professional learning communities and staff development days and providing time for teacher collaboration throughout the year,” Superintendent Brenda Wynder said. “We are proud of our teachers’ willingness to strive for student achievement and continuous improvement in our data. It has taken our entire ‘village’ to achieve this success.”
Bunting also spotlighted several other schools that have shown strong growth for subgroups and students overall.
- Caesar Rodney School District’s Allen Frear Elementary saw ELA proficiency for all students go from 69 percent to 83 percent between 2015 and 2019 with African American student proficiency improving from 46 percent to 72 percent. Math proficiency for all students moved from 60 percent to 72 percent with African American proficiency up from 34 percent to 57 percent in the same time period.
- Christina School District’s Etta Wilson Elementary also has seen consistent growth for multiple subgroups and students overall in both ELA and math. For ELA, all student proficiency this year is 72 percent, up from 49 percent in 2015. English learner proficiency improved from 13 percent to 66 percent, low-income from 35 percent to 61 percent, students with disabilities from 17 percent to 39 percent and Hispanic students from 34 percent to 67 in the same period. In math, 73 percent of students scored at the proficient level or higher this year, compared to 52 percent in 2015. These subgroups also saw growth throughout the years: African American (40 percent to 59 percent), English learner (19 percent to 63 percent), low-income (35 percent to 63 percent), students with disabilities (19 percent to 43 percent) and Hispanic (40 percent to 69 percent).
- Indian River School District’s Georgetown Middle School also has seen consistent success improving the scores of its students in ELA and math. For ELA, 64 percent of students overall passed the test in 2019, compared to 49 percent in 2015. Improvement among African American (40 percent to 60 percent), low-income (41 percent to 59 percent) and Hispanic students (44 percent to 62 percent) were included in the gains. For math, the growth from 2015 to 2019 overall was 34 percent to 55 percent with increases almost every year overall and among subgroups with an 11-percentage point gain just this year for English learner students. The overall growth for EL was 6 percent proficient in 2015 to 19 percent in 2019. Low-income students grew from 28 percent in 2015 to 50 percent this year with Hispanic student proficiency up to 52 percent in 2019, compared to 33 percent in 2015.
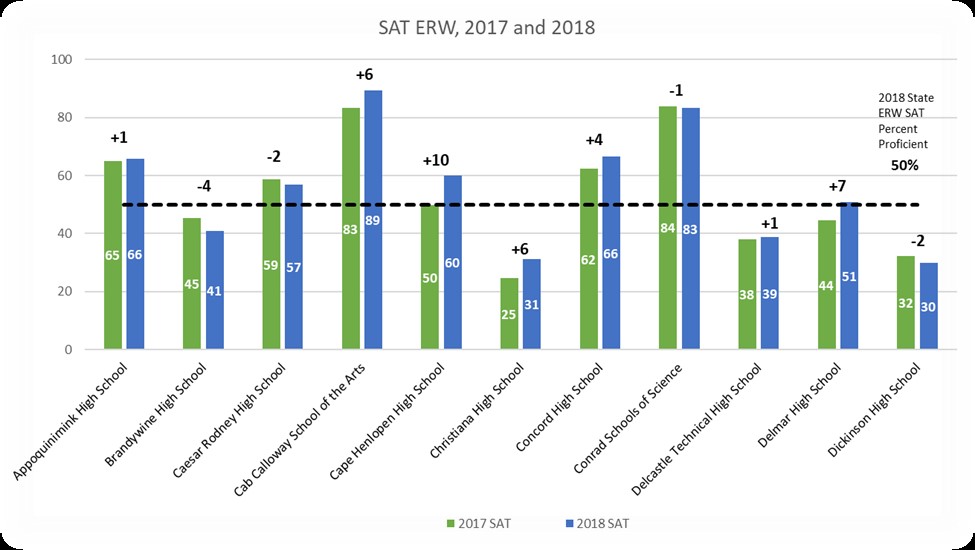
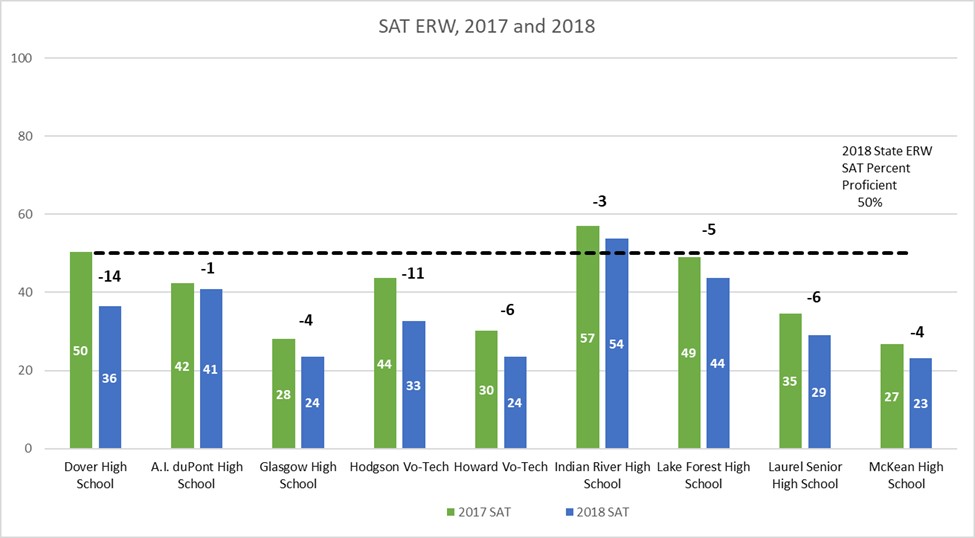
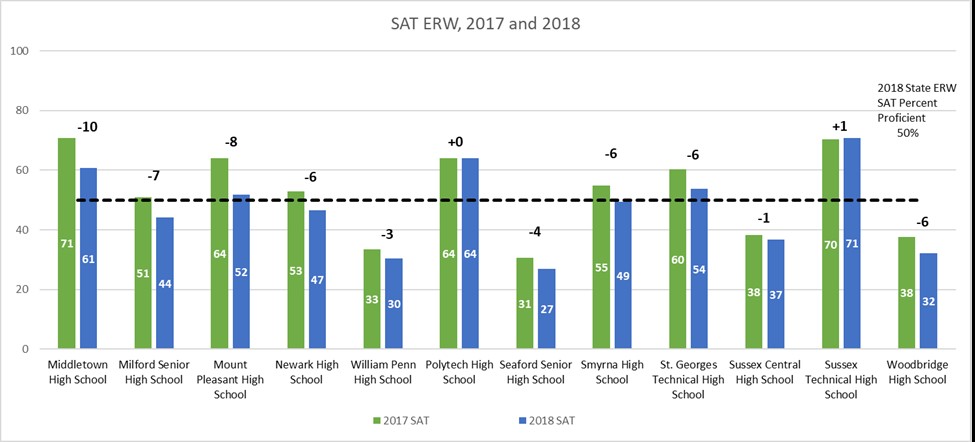
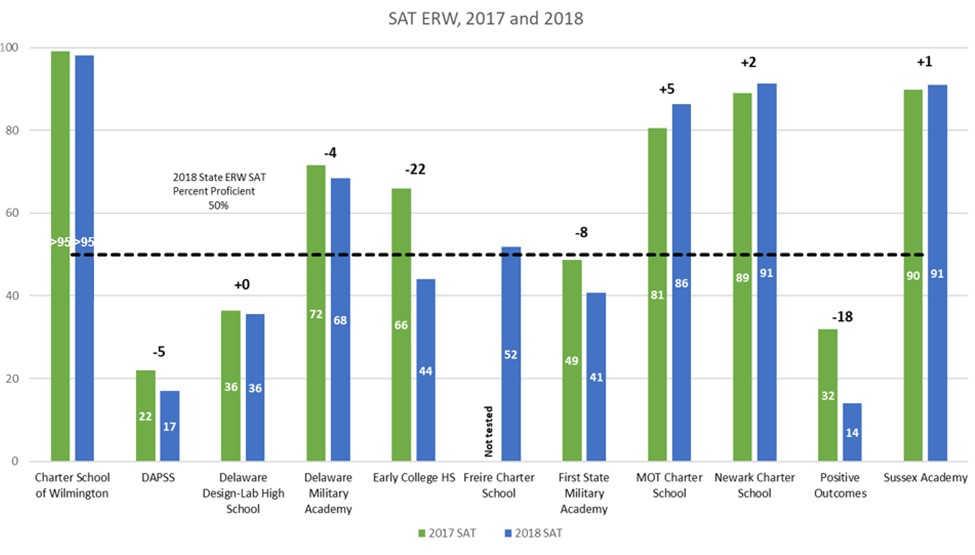
SAT
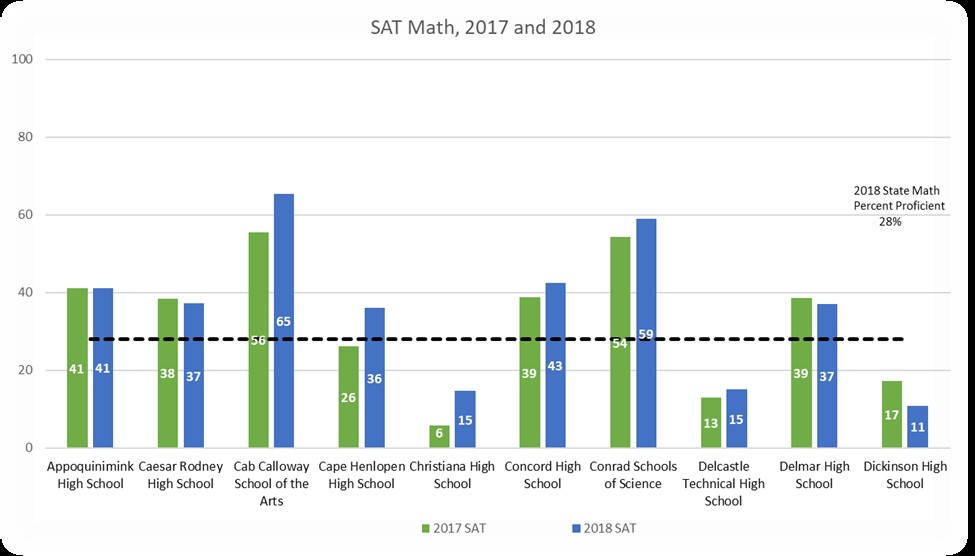
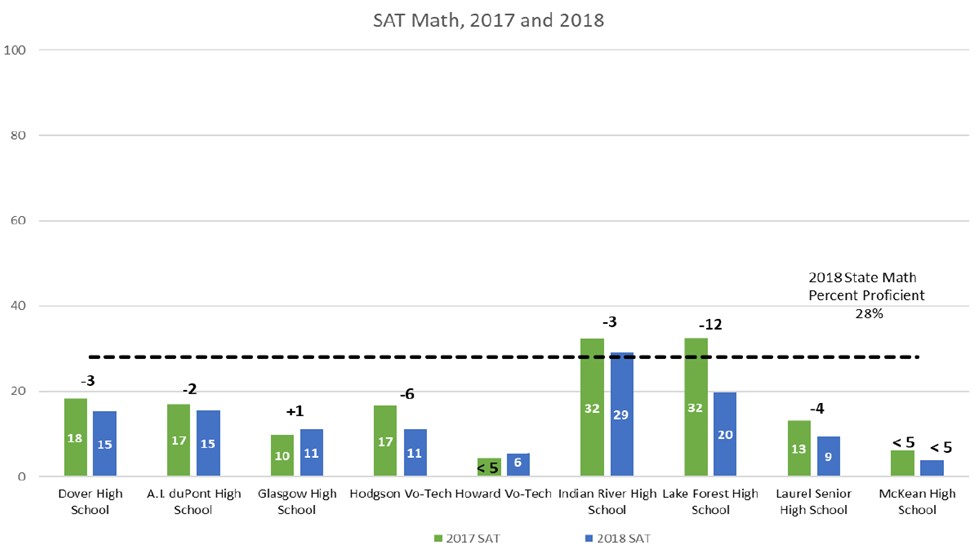
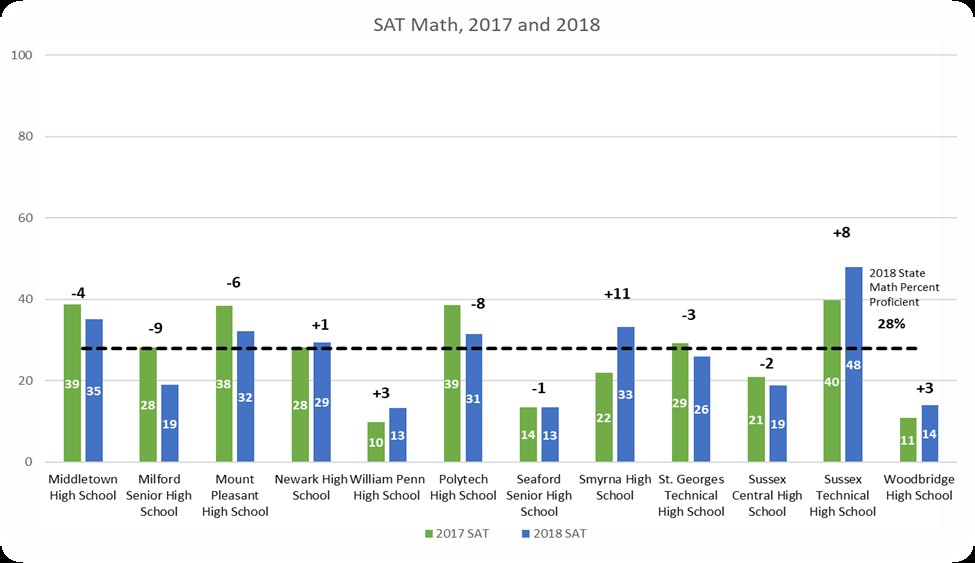
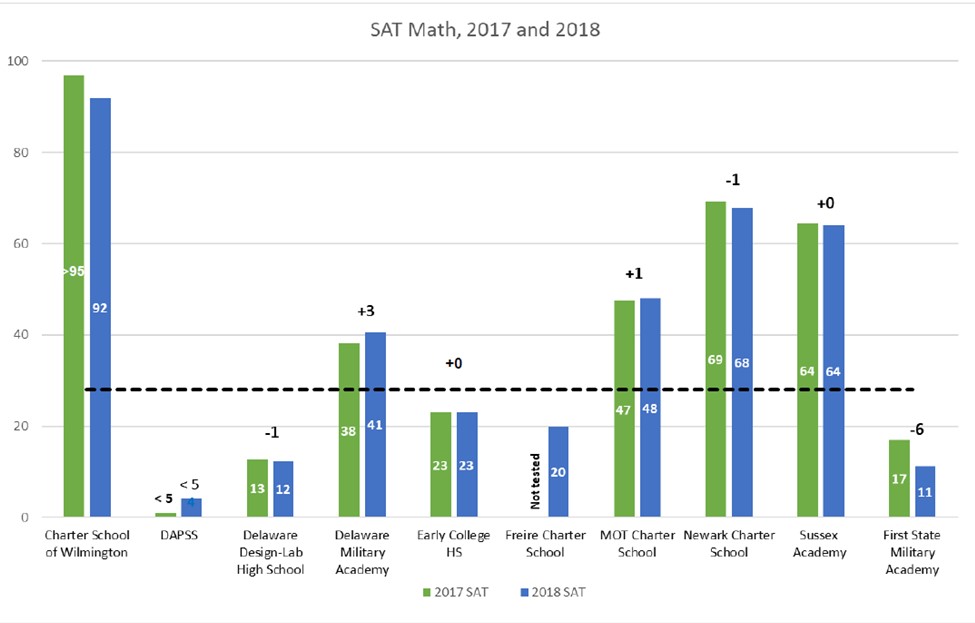
Delaware’s high school federal accountability test is the SAT, typically taken in 11th grade. Statewide 48 percent of students scored at the proficient level or higher in 2019 on the evidence-based reading and writing (ERW) portion, down 2 percentage points from 2018. In math, 28 percent of students did so, the same percentage as in 2018. For the essay portion of the exam, 42 percent of students scored at proficient or higher, down from 44 percent in 2018.
For math, Indian River School District saw gains. Indian River High School had 35 percent of students scoring at the proficient level or higher in 2019, up from 29 percent in 2018 and 32 percent in 2017. Sussex Central High School had 22 percent in 2019, up from 19 percent in 2018 and 21 percent in 2017. Colonial School District’s William Penn High School also has seen steady growth: 15 percent in 2019, up from 13 percent in 2018 and 10 percent in 2017.
Alternate assessment
This is the second year of administration for Delaware’s alternate assessment. The percentage of students scoring proficient is down in all three subject areas (ELA, math and science) from last year’s initial administration. The 2019 state average for ELA was 28 percent proficient, down from 32 percent in 2018; math was 15 percent in 2019, down from 17 percent in 2018; and science was 17 percent in 2019, down from 19 percent in 2018.
Media Contact: Alison May, alison.may@doe.k12.de.us, 302-735-4006