


2018 state assessment results hold steady
Department of Education | Newsroom | Date Posted: Wednesday, August 1, 2018

 Division of Small Business Launches Office of Small Business Access, Announces Listening Tours in July and August
 Delaware State Fire Commission Announces Appointment of Matthew M. Dodds as Director of the Delaware State Fire School
 Governor Meyer Signs Landmark Health Care Affordability Package to Lower Costs and Protect Patients
 DPH Confirms Second Positive Measles Case and Encourages Unvaccinated Residents to Seek Vaccination
 Delaware Supreme Court upholds Attorney General’s hearing authority in landmark opinion
 DNREC Seeks Volunteers for 2026 Delaware Coastal Cleanup on Saturday, Sept. 19 Governor Meyer Signs Executive Order Strengthening Conflict-of-interest Standards for Unclaimed Property Task Force AG Jennings, Mayor Carney and Chief Campos release body-worn camera footage
 DNREC Soliciting Project Proposals For Surface Water Matching Planning Grants
 OHS Urges Riders and Drivers to Stay Alert Following Recent Motorcycle Crashes
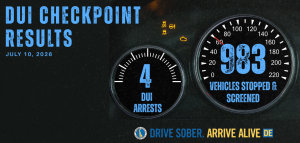 OHS Releases DUI Checkpoint Results, Reinforces Ongoing Efforts to Reduce Impaired Driving AG Jennings announces multistate settlement of bankruptcy claims against 23andMe over genetic data breach
 Governor Meyer Launches Delaware Commercial Corridor Initiative To Support Small Businesses
 Governor Meyer Orders the Lowering of Flags in Concurrence with White House
 Delaware Office of Highway Safety Sober Rides Program Helped More Than 900 Delawareans Get Home Safely Governor Meyer’s Statement on Traffic Stop in Dover, Pledges Full Investigation AG Jennings announces $45 million multistate settlement with Block Inc. over deceptive practices on Cash App
 Talk & Film Bring Delaware’s Revolutionary Story to Life at Archives’ First Saturday Program Governor Meyer Vetoes $35 Million Legislative Hall Expansion Amid Affordability Concerns
 Delaware Hospitals Adopt Statewide Emergency Department Guidance for Opioid Use Disorder Treatment
 Gov. Meyer Signs Banking Modernization Package to Strengthen Delaware’s Leadership in Financial Services
 Newly Launched Initiative Strengthens Delaware’s Health Information Technology Infrastructure Attorney General Jennings announces two major victories striking down executive orders on elections
 Delaware’s 153rd General Assembly Advances DHSS Priorities to Lower Costs, Strengthen Care Workforce Gov. Meyer Signs FY2027 Budget Investing in Education, Affordability, and Opportunity
 Delaware students earn national STEM recognition through Career and Technical Education
 Delaware students earn national recognition while building the future of healthcare
 Delaware on Main Street Program Grows as 17 Communities Earn National Designations Gov. Meyer Calls Upon Delaware Public Service Commission to Suspend Delmarva Rate Hike
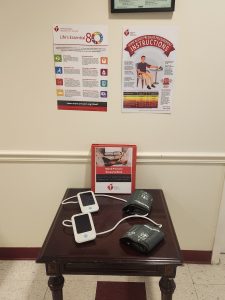 DSHA, American Heart Association to provide blood pressure monitoring devices in public housing communities
 Dozens of Incarcerated Students Earn High School Diplomas as Academic Year Closes DOJ secures 59-year sentence for Wilmington man who caused fatal collision that claimed two lives, injured four others DOJ announces sentence for final Exit 4 member associated with four-year crime spree
 National Grant Initiative Invests in Delaware’s Indigenous and Cuban Cultural Traditions
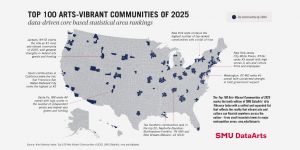 Delaware and Wilmington Named Among Nation’s Most Arts-Vibrant by SMU DataArts
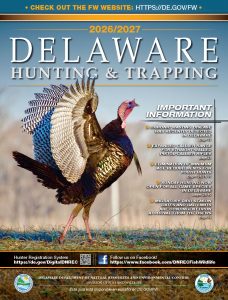
 DNREC Asks Public to Report Sightings of Wild Turkeys During Annual Survey
 Office of Women’s Advancement & Advocacy & Delaware Women’s Commission Announce 2026 She’s on Her Way Award Recipients DOJ indicts suspected Wilmington Hospital shooter on multiple felony charges
 Military Families Can Visit Select Museums for Free this Summer as part of Blue Star Museums
 Delaware State Parks Kicks Off Virtual 5K Fundraiser to Celebrate 75th Anniversary
 Visit Delaware and 1440 Film Co. Win Telly Award for “Back of House” Video Series
 ADVISORY: State Leaders to Host Press Conference Launching Legislative Hall Period Product Drive
 Delaware SUN Bucks Available in June to Help Families Feed Children this Summer
 DNREC Offers Expanded Assistance for Farmers Due to Significantly Increased Reports of Deer Damage AG Jennings secures final victory over Trump Administration’s ban on offshore wind permitting Governor Meyer Calls for Immediate Action to Protect Delaware Ratepayers and Hold Utilities Accountable
 Governor Meyer and DSHA Announce Major Step Forward for Hope Center Expansion in Kent County
Department of Education | Newsroom | Date Posted: Wednesday, August 1, 2018

Some districts, schools show greater gains
Statewide assessment results released today show gains made in some districts and schools with local administrators crediting a variety of supports for their students’ growth.
District and charter leaders in the schools said they used state-provided resources such as a free digital library of teacher-designed curricular supports as well as interim assessments to better identify student learning gaps and target instructional support. Many also credited strong, systematic professional learning for educators and the use of professional learning communities to give staff time during the school day to discuss student learning and focus instructional supports.
“Our educators and students worked hard to achieve these successes,” Secretary of Education Susan Bunting said. “We’re seeing more schools and districts using tools provided by the state to help inform instruction and improve student learning. We will continue supporting our teachers so that we can collectively improve achievement levels across the state.”
Today’s release includes results from the Smarter English language arts (ELA) and mathematics assessments given in grades 3 to 8 and the SAT administered in high school. Because the state is transitioning to new science and social studies assessments, students took field tests in those subjects this year. Results for the state’s alternate assessment, administered to those students with significant cognitive disabilities, also were released.
Educators already have received their students’ scores — Smarter results, for example, are available to teachers three weeks after their students complete the test — and were able to use them to plan instruction for the remainder of the school year. Families will receive score reports with their children’s results via U.S. mail beginning next week. Family guides and other resources are available on DelExcels.
For more information on state assessment results, visit the online assessment tables and see the 2018 assessment presentation.
Smarter Assessment (ELA/mathematics)
Overall percentages of students scoring at the proficient level or higher statewide largely held steady from last year with more change visible at the district and school levels.
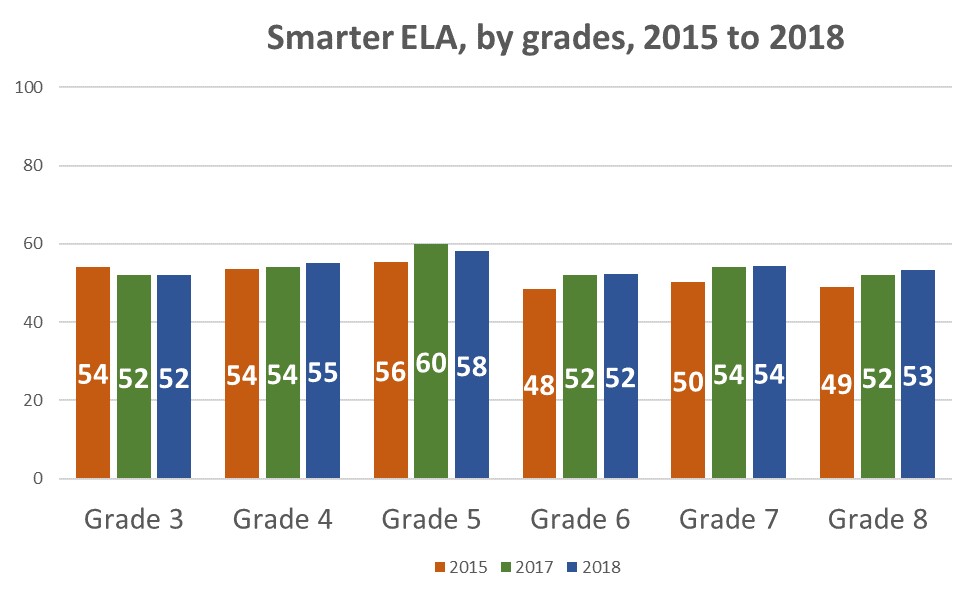
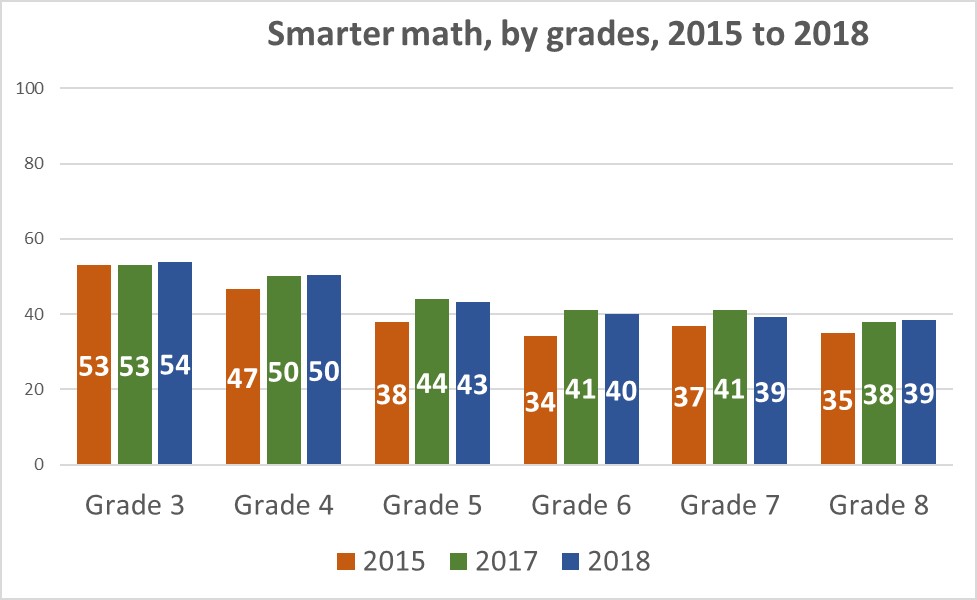
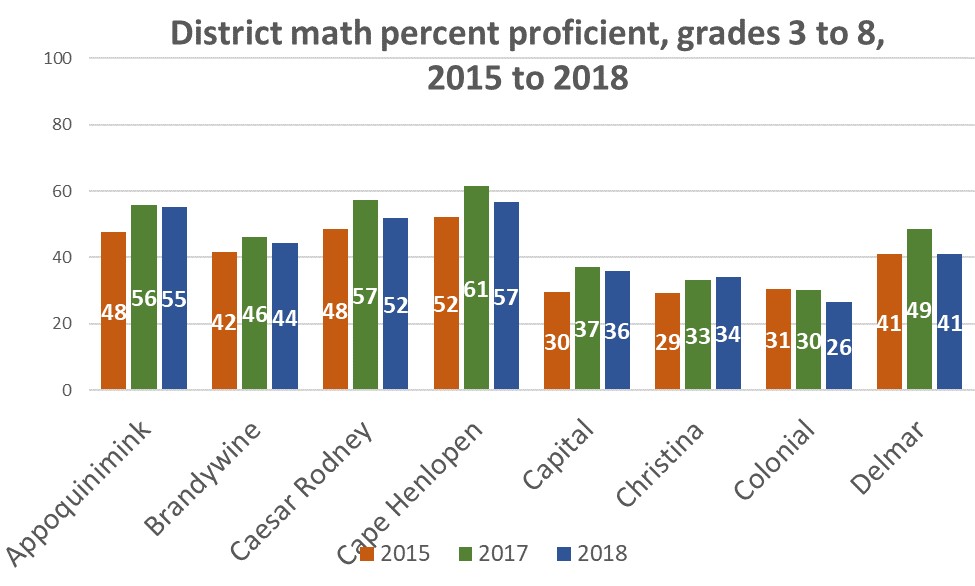
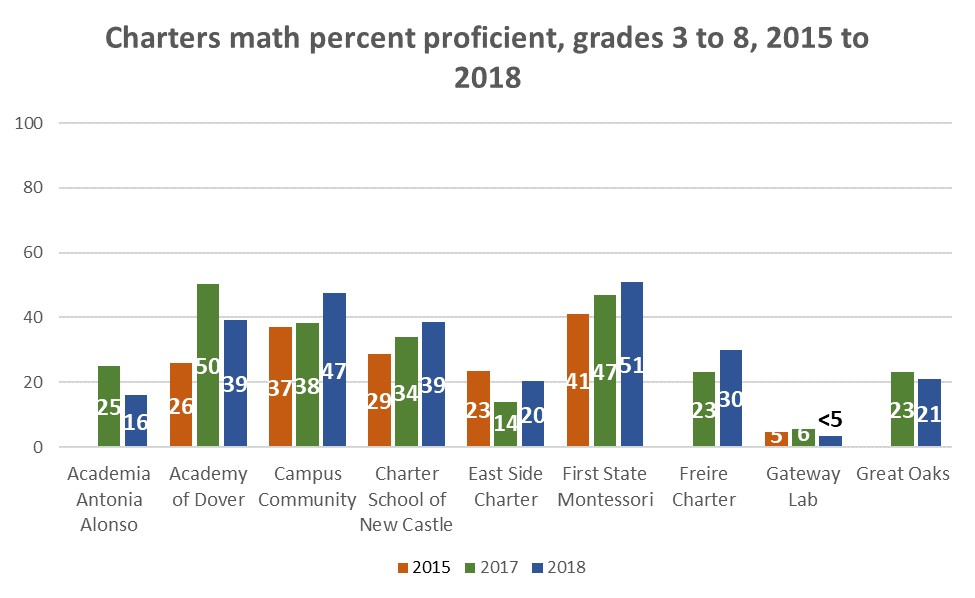
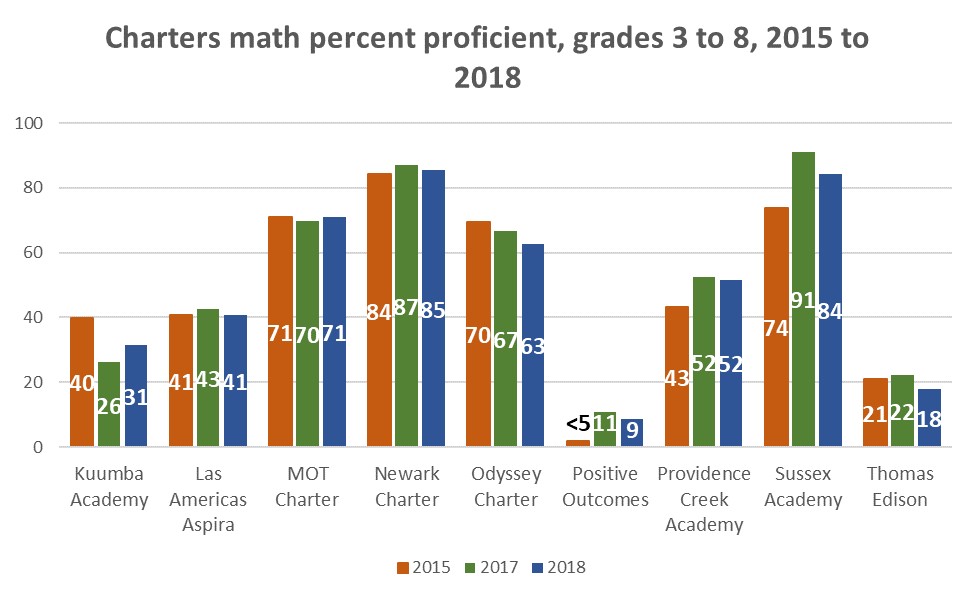
Statewide, 54 percent of students scored a 3 or higher on the 4-scale Smarter assessment in ELA this year, compared to 54 percent in 2017 and 52 percent in 2015, the first year the assessment was administered. In mathematics, 44 percent of students scored at 3 or higher in 2018, compared to 45 percent last year and 39 percent in 2015. The following chart shows the grade-level results.
Note: While Smarter currently is tested in grades 3-8, in 2015, it included grade 11.
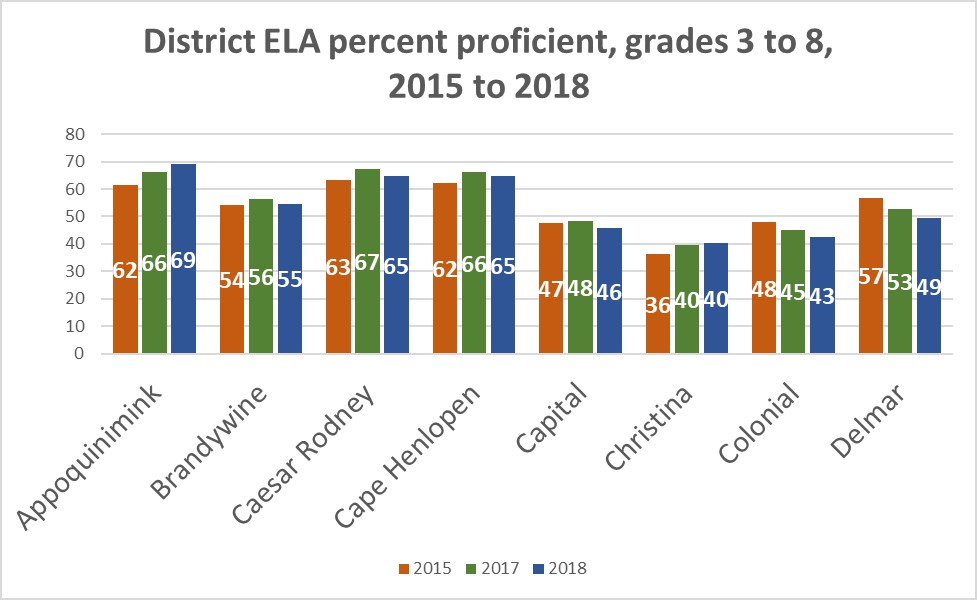
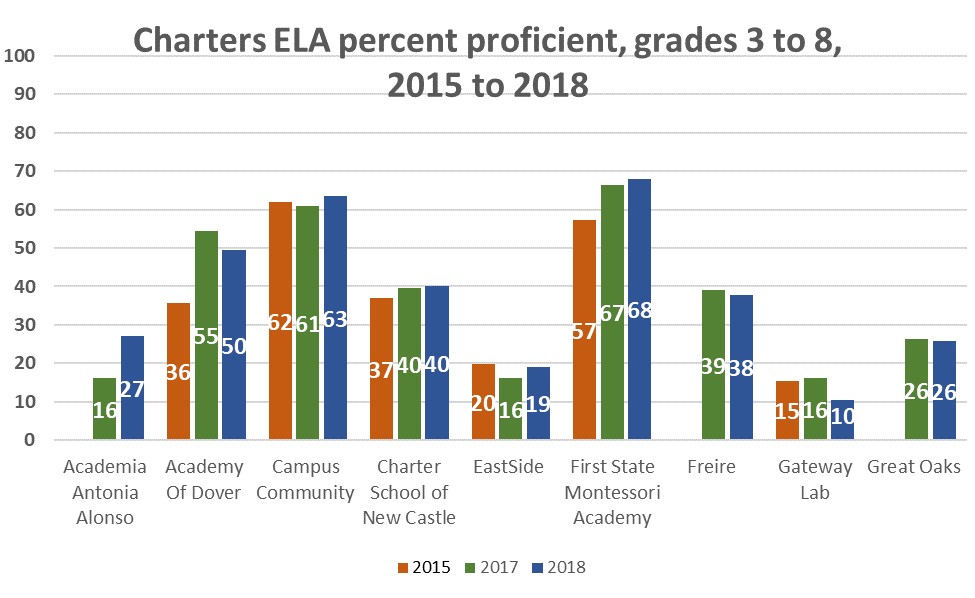
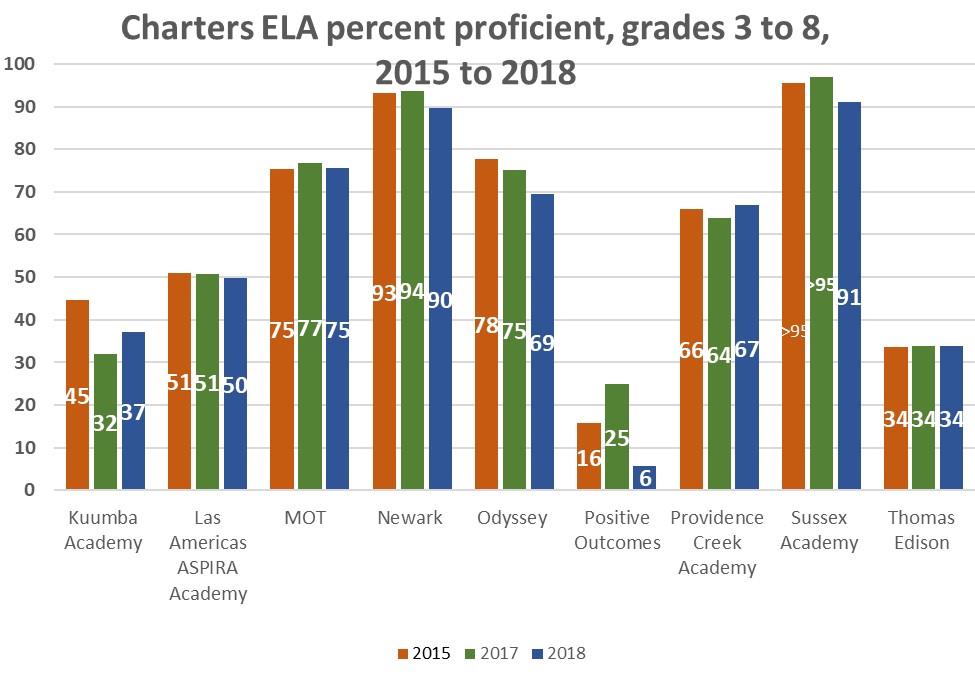
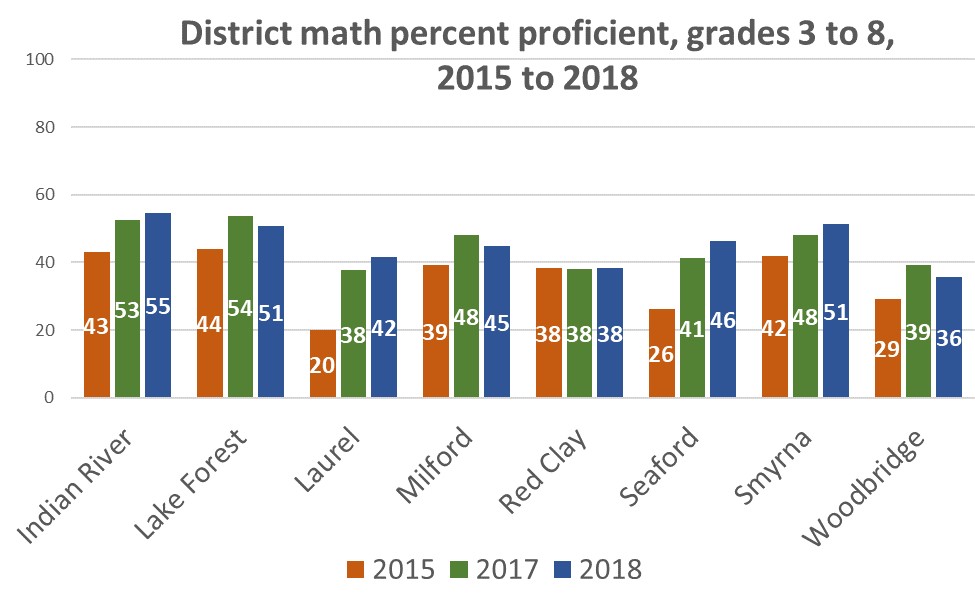
The district with the highest performance overall in ELA was Appoquinimink followed by Cape Henlopen and Caesar Rodney, tied for second. In math, Cape Henlopen led the state followed by Appoquinimink and Indian River, tied for second. Newark Charter and Sussex Academy topped charter schools in the state for ELA and math.
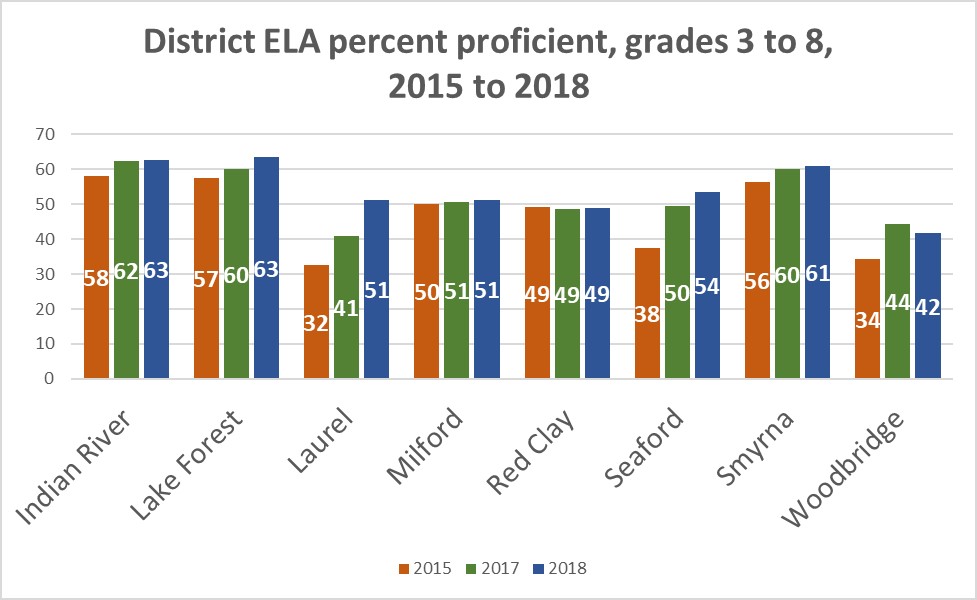
Laurel School District’s gains were the greatest in the state for ELA and second greatest for math this year. ELA went from 32 percent proficient in 2015 to 41 percent in 2017 and 51 percent in 2018, a 10-percentage point increase since last year and a 19-percentage point increase since the assessment was first administered. In math, the percent proficient went from 20 percent in 2015 to 38 percent in 2017 and 42 percent in 2018.
“First and foremost, we credit our successes to our diligent and dedicated instructors, who worked collaboratively in school data teams analyzing student performance to foster a continuous improvement model throughout our schools,” Laurel Superintendent Shawn Larrimore said, Ed.D. “Paramount to this cycle of continuous improvement was the implementation of several key areas of focus, including a highly-personalized blended (Response to Intervention) model for all students; consistent student exposure to, and deep analysis of, the Smarter Interim Assessments; and the integration of the Smarter Digital Library Playlists into our daily instructional routine. Additionally, the district has continued to provide individualized content area coaching for all instructional staff through university partnerships and internal instructional coaches to continuously improve planning, instructional delivery, and professional learning communities collaboration.”
In fact, North Laurel Elementary had the greatest gains of any building in the state in ELA last year and was in the Top 10 for math.
In this video, Laurel district and school educators talk about the positive impact state-provided Smarter instructional supports had on their students’ learning.
“Usually after we take the interim assessments, we can find out the areas of need,” fourth grade ELA teacher Jamie Pastusak said. “And then we can go into the digital library and usually through a collaborative group during PLC time or maybe even during our teaching teams, we are able to find lessons that we can pinpoint exactly how to best meet the needs of those students.”
Fourth grade special education teacher Kati Hartstein also praised the resources.
“The level of information that we get from the interim assessments is extremely informative. We know specifically which students are struggling in which areas and then we can go to the digital library and find lessons and resources for that specific topic,” she said.
In math, the district with the strongest gains this year was Seaford, showing districtwide increase of about 5 percentage points, bringing its overall proficiency to 46 percent. Seaford also was second highest in the state in ELA gains, up 4 percentage points since last year (50 to 54 percent).
Seaford’s Douglass Elementary had the strongest math gains of any school in the state: a nearly 14-percentage point increase over last year (47 percent proficient in 2017 compared to 61 percent in 2018).
“We are excited about the continuing progress our students are making,” Seaford Superintendent David Perrington said. “This type of progress is made possible through the efforts of many. The Seaford School District is fortunate to have strong and committed building leadership that believes all students will be successful. We have teachers and staff that believe they can make a difference and they do so each day with our students. The district has provided an environment where high quality curriculum resources and meaningful professional development is available and implemented with data driven focus. Our schools have become places of learning that provide enriching experiences for every student.”
Many buildings across the state have their own success stories.
Capital School District’s Towne Point Elementary and Fairview Elementary both were in the Top 10 schools with growth for math, making double-digit gains.
Capital Supervisor of Elementary Instruction Pam Herrera said Capital used system-wide professional learning for school-level teams focused on specific strategies and classroom application of the academic standards based on needs identified at the school level.
“As a part of Capital’s feedback cycle, teams for both ELA and math engaged in (professional learning communities) and school-based meetings, grade-level coaching cycles with instructional coaches, opportunities for peer-to-peer classroom visitations (both within the school and across the district to other district schools), and sharing of evidence to ‘showcase’ their work by creating a virtual album that was shared across schools,” Herrera said, adding some elementary schools “focused on small group instruction in math and the coordination of services for small group support and intervention/enrichment support.”
Herrera also credited strategies for increasing rigor and providing more opportunities during math instruction for mathematical thinking and problem solving and bringing student tasks to professional learning communities for helping guide schools to focus on identifying specific student needs related to standards and to plan collaboratively to better meet student needs.
Likewise, in ELA, there was a strategic focus on developing strategies for teaching academic vocabulary to enable students to master crucial concepts and gain a more in-depth understanding of new vocabulary and complex texts, Herrera said, adding that schools focused on the outcomes of understanding text and the indicators of deeper comprehension. The use of craft lessons for writing, particularly mentor sentences, were used to serve as examples to help students identify different elements of writing including structure and style, she said.
In the coming weeks, the state will be taking a closer look at the results to identify strong gains and setbacks in subgroup performance to better understand the changes reflected in the overall scores. The department will look at performance based on socioeconomic status and racial demographics as well as for students with disabilities and those who are identified as English learners.
Full district-, charter- and school-level results are available here.
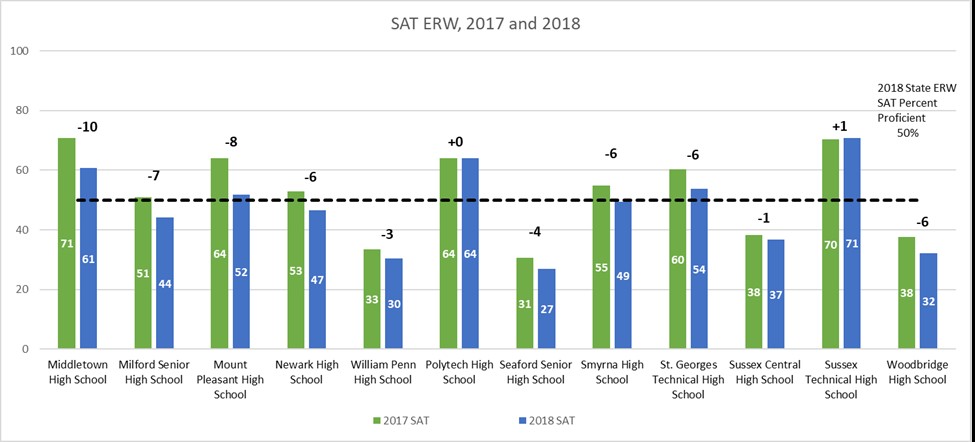
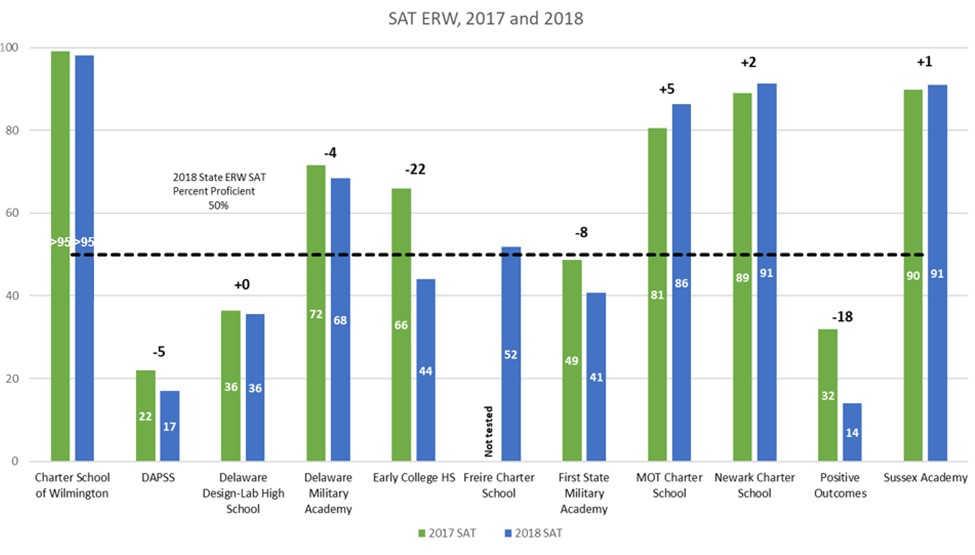
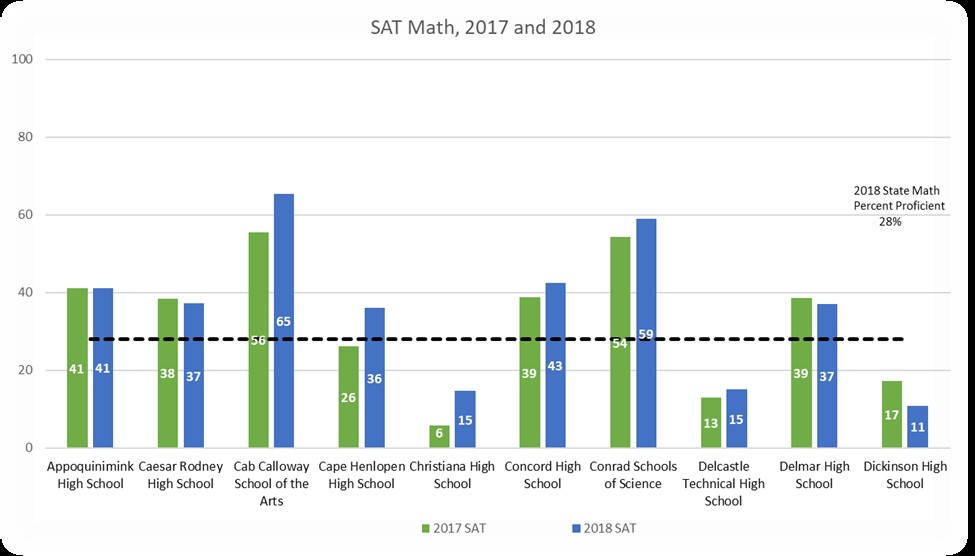
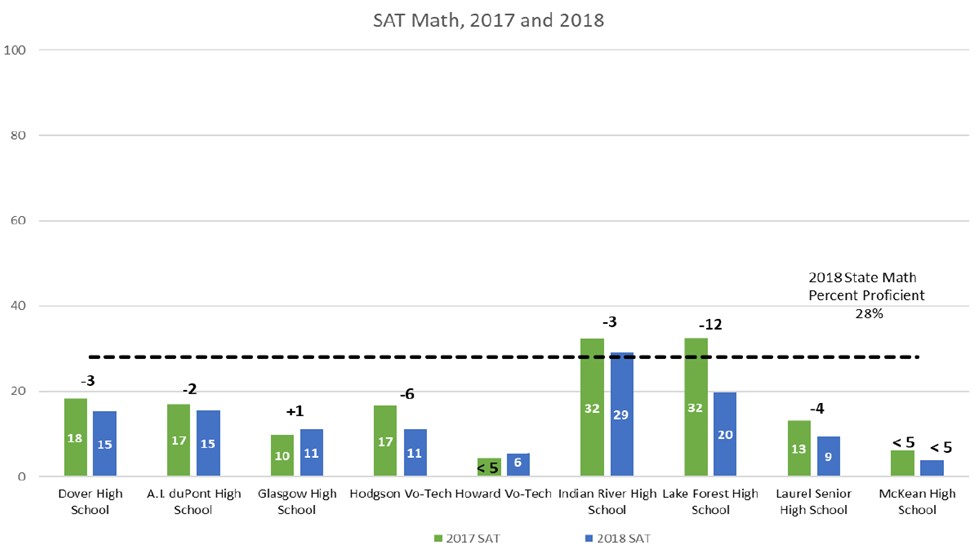
SAT
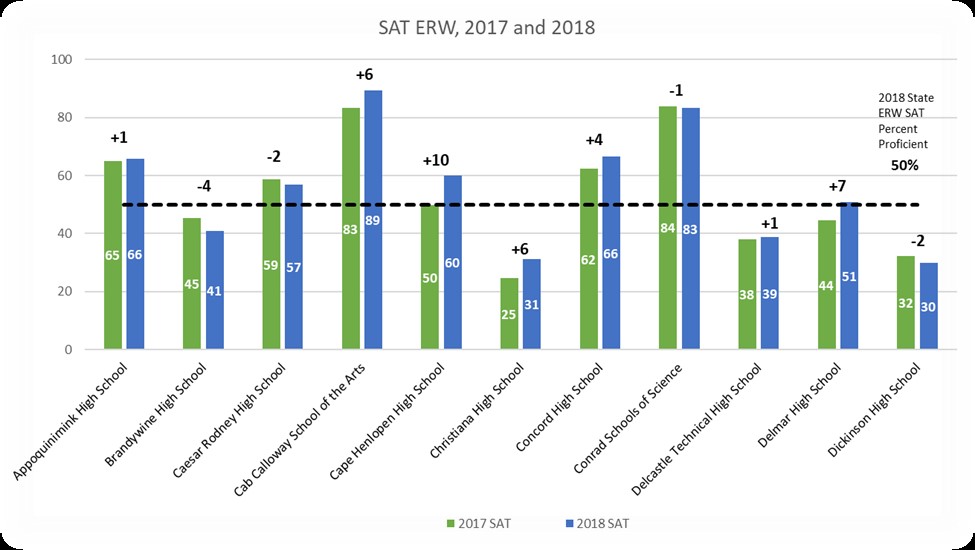
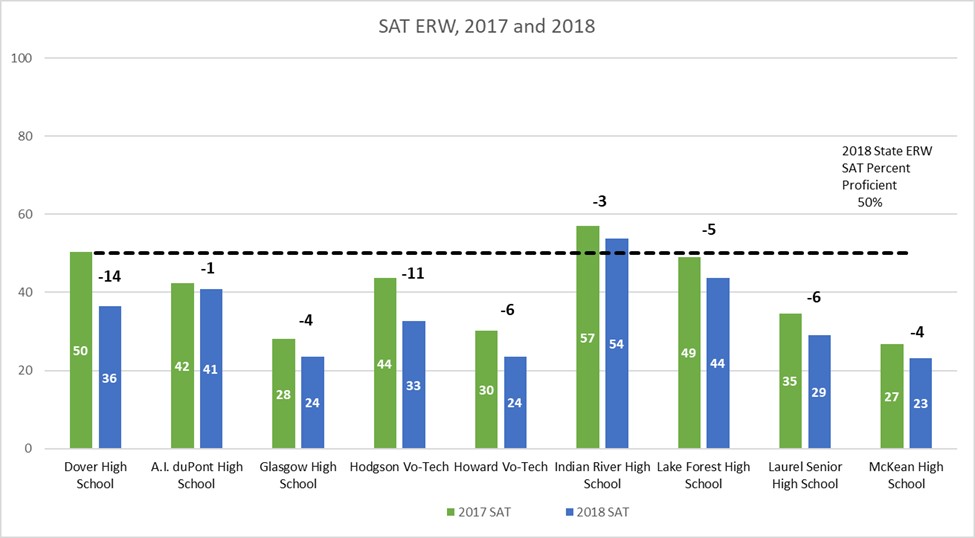
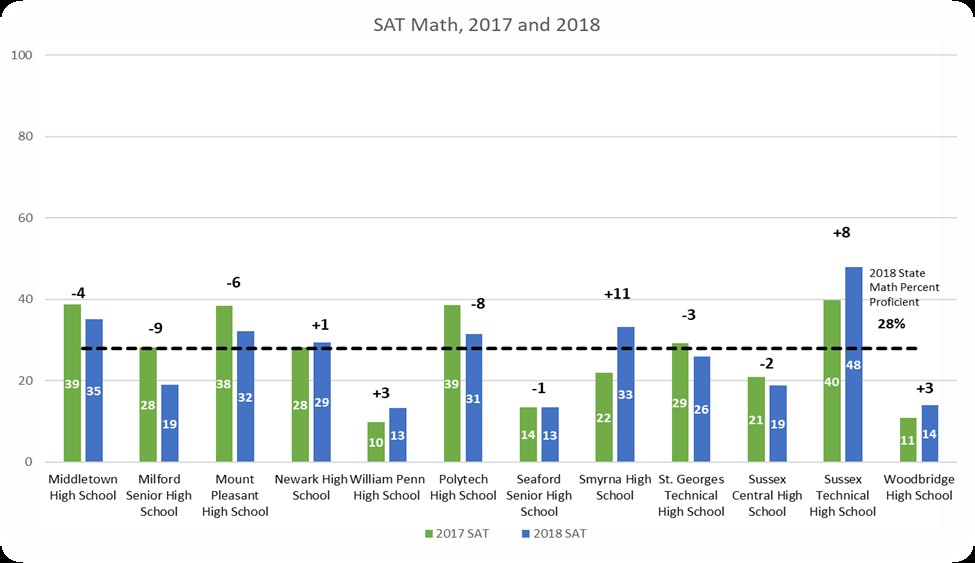
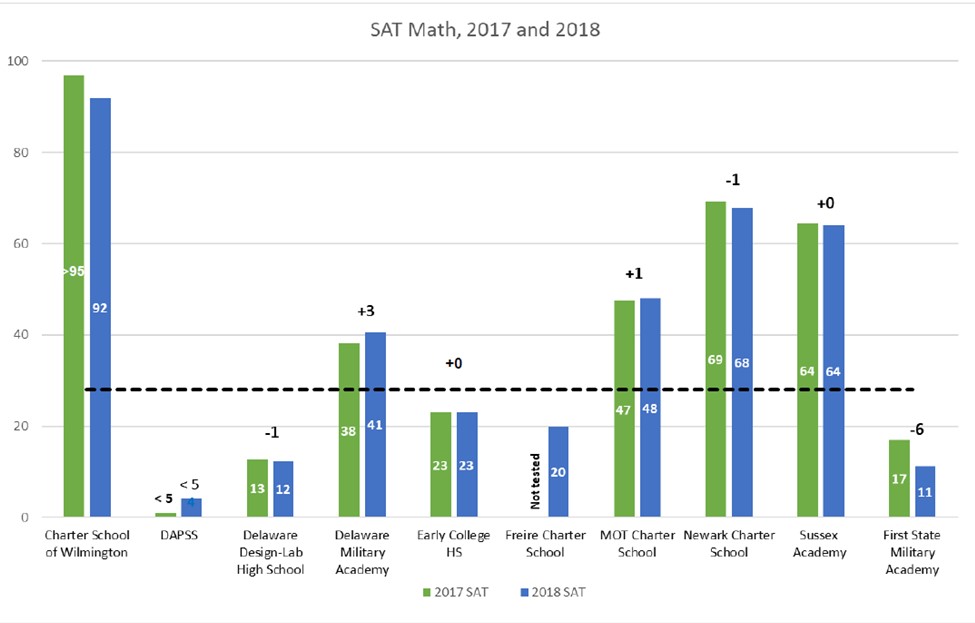
In SAT, the state’s accountability test for high school, overall state proficiency in the SAT evidence-based reading and writing (ERW) assessment was 50 percent this year – a 3-percentage point decrease. In math, 28 percent of students demonstrated proficiency this year compared to 29 percent in 2017.
It is important to note that today’s score release is distinct from the College Board release in September. In that annual release, the College Board, which administers the SAT, reports on graduating class data. Today’s release by the state reflects the scores of the incoming Class of 2019.
Three charter schools topped the state in ERW and math scores: Charter School of Wilmington, Newark Charter and Sussex Academy. The top-ranking district high schools for both subjects were magnet schools in Red Clay Consolidated School District: Cab Calloway School of the Arts and Conrad Schools of Science.
Alternate assessment
This year the state launched a new alternate assessment for students with severe cognitive disabilities thus no comparative data is provided for prior years.
In ELA, scores ranged from 12 percentage of students scoring at the proficient level in 3rd grade to a high of 42 percent in eighth grade. In math, the scores ranged from a low of 8 percent in seventh grade to a high of 30 percent in fourth grade. Science was assessed in grades 5, 8 and 10 with 12, 23 and 21 percent of students scoring at the proficient level in each grade, respectively.
More about state-provided resources
Keep up to date by receiving a daily digest email, around noon, of current news release posts from state agencies on news.delaware.gov.
Here you can subscribe to future news updates.
Department of Education | Newsroom | Date Posted: Wednesday, August 1, 2018
Some districts, schools show greater gains
Statewide assessment results released today show gains made in some districts and schools with local administrators crediting a variety of supports for their students’ growth.
District and charter leaders in the schools said they used state-provided resources such as a free digital library of teacher-designed curricular supports as well as interim assessments to better identify student learning gaps and target instructional support. Many also credited strong, systematic professional learning for educators and the use of professional learning communities to give staff time during the school day to discuss student learning and focus instructional supports.
“Our educators and students worked hard to achieve these successes,” Secretary of Education Susan Bunting said. “We’re seeing more schools and districts using tools provided by the state to help inform instruction and improve student learning. We will continue supporting our teachers so that we can collectively improve achievement levels across the state.”
Today’s release includes results from the Smarter English language arts (ELA) and mathematics assessments given in grades 3 to 8 and the SAT administered in high school. Because the state is transitioning to new science and social studies assessments, students took field tests in those subjects this year. Results for the state’s alternate assessment, administered to those students with significant cognitive disabilities, also were released.
Educators already have received their students’ scores — Smarter results, for example, are available to teachers three weeks after their students complete the test — and were able to use them to plan instruction for the remainder of the school year. Families will receive score reports with their children’s results via U.S. mail beginning next week. Family guides and other resources are available on DelExcels.
For more information on state assessment results, visit the online assessment tables and see the 2018 assessment presentation.
Smarter Assessment (ELA/mathematics)
Overall percentages of students scoring at the proficient level or higher statewide largely held steady from last year with more change visible at the district and school levels.
Statewide, 54 percent of students scored a 3 or higher on the 4-scale Smarter assessment in ELA this year, compared to 54 percent in 2017 and 52 percent in 2015, the first year the assessment was administered. In mathematics, 44 percent of students scored at 3 or higher in 2018, compared to 45 percent last year and 39 percent in 2015. The following chart shows the grade-level results.
Note: While Smarter currently is tested in grades 3-8, in 2015, it included grade 11.
The district with the highest performance overall in ELA was Appoquinimink followed by Cape Henlopen and Caesar Rodney, tied for second. In math, Cape Henlopen led the state followed by Appoquinimink and Indian River, tied for second. Newark Charter and Sussex Academy topped charter schools in the state for ELA and math.
Laurel School District’s gains were the greatest in the state for ELA and second greatest for math this year. ELA went from 32 percent proficient in 2015 to 41 percent in 2017 and 51 percent in 2018, a 10-percentage point increase since last year and a 19-percentage point increase since the assessment was first administered. In math, the percent proficient went from 20 percent in 2015 to 38 percent in 2017 and 42 percent in 2018.
“First and foremost, we credit our successes to our diligent and dedicated instructors, who worked collaboratively in school data teams analyzing student performance to foster a continuous improvement model throughout our schools,” Laurel Superintendent Shawn Larrimore said, Ed.D. “Paramount to this cycle of continuous improvement was the implementation of several key areas of focus, including a highly-personalized blended (Response to Intervention) model for all students; consistent student exposure to, and deep analysis of, the Smarter Interim Assessments; and the integration of the Smarter Digital Library Playlists into our daily instructional routine. Additionally, the district has continued to provide individualized content area coaching for all instructional staff through university partnerships and internal instructional coaches to continuously improve planning, instructional delivery, and professional learning communities collaboration.”
In fact, North Laurel Elementary had the greatest gains of any building in the state in ELA last year and was in the Top 10 for math.
In this video, Laurel district and school educators talk about the positive impact state-provided Smarter instructional supports had on their students’ learning.
“Usually after we take the interim assessments, we can find out the areas of need,” fourth grade ELA teacher Jamie Pastusak said. “And then we can go into the digital library and usually through a collaborative group during PLC time or maybe even during our teaching teams, we are able to find lessons that we can pinpoint exactly how to best meet the needs of those students.”
Fourth grade special education teacher Kati Hartstein also praised the resources.
“The level of information that we get from the interim assessments is extremely informative. We know specifically which students are struggling in which areas and then we can go to the digital library and find lessons and resources for that specific topic,” she said.
In math, the district with the strongest gains this year was Seaford, showing districtwide increase of about 5 percentage points, bringing its overall proficiency to 46 percent. Seaford also was second highest in the state in ELA gains, up 4 percentage points since last year (50 to 54 percent).
Seaford’s Douglass Elementary had the strongest math gains of any school in the state: a nearly 14-percentage point increase over last year (47 percent proficient in 2017 compared to 61 percent in 2018).
“We are excited about the continuing progress our students are making,” Seaford Superintendent David Perrington said. “This type of progress is made possible through the efforts of many. The Seaford School District is fortunate to have strong and committed building leadership that believes all students will be successful. We have teachers and staff that believe they can make a difference and they do so each day with our students. The district has provided an environment where high quality curriculum resources and meaningful professional development is available and implemented with data driven focus. Our schools have become places of learning that provide enriching experiences for every student.”
Many buildings across the state have their own success stories.
Capital School District’s Towne Point Elementary and Fairview Elementary both were in the Top 10 schools with growth for math, making double-digit gains.
Capital Supervisor of Elementary Instruction Pam Herrera said Capital used system-wide professional learning for school-level teams focused on specific strategies and classroom application of the academic standards based on needs identified at the school level.
“As a part of Capital’s feedback cycle, teams for both ELA and math engaged in (professional learning communities) and school-based meetings, grade-level coaching cycles with instructional coaches, opportunities for peer-to-peer classroom visitations (both within the school and across the district to other district schools), and sharing of evidence to ‘showcase’ their work by creating a virtual album that was shared across schools,” Herrera said, adding some elementary schools “focused on small group instruction in math and the coordination of services for small group support and intervention/enrichment support.”
Herrera also credited strategies for increasing rigor and providing more opportunities during math instruction for mathematical thinking and problem solving and bringing student tasks to professional learning communities for helping guide schools to focus on identifying specific student needs related to standards and to plan collaboratively to better meet student needs.
Likewise, in ELA, there was a strategic focus on developing strategies for teaching academic vocabulary to enable students to master crucial concepts and gain a more in-depth understanding of new vocabulary and complex texts, Herrera said, adding that schools focused on the outcomes of understanding text and the indicators of deeper comprehension. The use of craft lessons for writing, particularly mentor sentences, were used to serve as examples to help students identify different elements of writing including structure and style, she said.
In the coming weeks, the state will be taking a closer look at the results to identify strong gains and setbacks in subgroup performance to better understand the changes reflected in the overall scores. The department will look at performance based on socioeconomic status and racial demographics as well as for students with disabilities and those who are identified as English learners.
Full district-, charter- and school-level results are available here.
SAT
In SAT, the state’s accountability test for high school, overall state proficiency in the SAT evidence-based reading and writing (ERW) assessment was 50 percent this year – a 3-percentage point decrease. In math, 28 percent of students demonstrated proficiency this year compared to 29 percent in 2017.
It is important to note that today’s score release is distinct from the College Board release in September. In that annual release, the College Board, which administers the SAT, reports on graduating class data. Today’s release by the state reflects the scores of the incoming Class of 2019.
Three charter schools topped the state in ERW and math scores: Charter School of Wilmington, Newark Charter and Sussex Academy. The top-ranking district high schools for both subjects were magnet schools in Red Clay Consolidated School District: Cab Calloway School of the Arts and Conrad Schools of Science.
Alternate assessment
This year the state launched a new alternate assessment for students with severe cognitive disabilities thus no comparative data is provided for prior years.
In ELA, scores ranged from 12 percentage of students scoring at the proficient level in 3rd grade to a high of 42 percent in eighth grade. In math, the scores ranged from a low of 8 percent in seventh grade to a high of 30 percent in fourth grade. Science was assessed in grades 5, 8 and 10 with 12, 23 and 21 percent of students scoring at the proficient level in each grade, respectively.
More about state-provided resources
Keep up to date by receiving a daily digest email, around noon, of current news release posts from state agencies on news.delaware.gov.
Here you can subscribe to future news updates.
Delaware's Governor
State Agencies
Elected Officials
General Assembly
Delaware Courts
State Employees
Cities & Towns
Delaware State Code
State Regulations
Business First Steps
Phone Directory
Locations Directory
Public Meetings
Voting & Elections
Transparency
Delaware Marketplace
Tax Center
Personal Income Tax
Privacy Policy
Weather & Travel
Contact Us
Corporations
Franchise Tax
Gross Receipts Tax
Withholding Tax
Delaware Topics
Help Center
Mobile Apps
E-mail / Text Alerts
Social Media

Built by the Government Information Center
©MMXXVI Delaware.gov
