


More Delaware students graduating high school
Department of Education | Newsroom | Date Posted: Wednesday, June 19, 2019

 AG Jennings announces multistate settlement of bankruptcy claims against 23andMe over genetic data breach
 Governor Meyer Launches Delaware Commercial Corridor Initiative To Support Small Businesses
 Governor Meyer Orders the Lowering of Flags in Concurrence with White House
 Delaware Office of Highway Safety Sober Rides Program Helped More Than 900 Delawareans Get Home Safely
 Governor Meyer’s Statement on Traffic Stop in Dover, Pledges Full Investigation
 Talk & Film Bring Delaware’s Revolutionary Story to Life at Archives’ First Saturday Program Governor Meyer Vetoes $35 Million Legislative Hall Expansion Amid Affordability Concerns
 Delaware Hospitals Adopt Statewide Emergency Department Guidance for Opioid Use Disorder Treatment
 Gov. Meyer Signs Banking Modernization Package to Strengthen Delaware’s Leadership in Financial Services
 Newly Launched Initiative Strengthens Delaware’s Health Information Technology Infrastructure Attorney General Jennings announces two major victories striking down executive orders on elections
 Delaware’s 153rd General Assembly Advances DHSS Priorities to Lower Costs, Strengthen Care Workforce Gov. Meyer Signs FY2027 Budget Investing in Education, Affordability, and Opportunity
 Delaware students earn national STEM recognition through Career and Technical Education
 Delaware students earn national recognition while building the future of healthcare
 Delaware on Main Street Program Grows as 17 Communities Earn National Designations Gov. Meyer Calls Upon Delaware Public Service Commission to Suspend Delmarva Rate Hike
 DSHA, American Heart Association to provide blood pressure monitoring devices in public housing communities
 Dozens of Incarcerated Students Earn High School Diplomas as Academic Year Closes DOJ secures 59-year sentence for Wilmington man who caused fatal collision that claimed two lives, injured four others DOJ announces sentence for final Exit 4 member associated with four-year crime spree
 National Grant Initiative Invests in Delaware’s Indigenous and Cuban Cultural Traditions
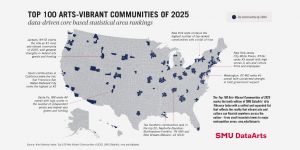 Delaware and Wilmington Named Among Nation’s Most Arts-Vibrant by SMU DataArts
 DNREC Asks Public to Report Sightings of Wild Turkeys During Annual Survey
 Office of Women’s Advancement & Advocacy & Delaware Women’s Commission Announce 2026 She’s on Her Way Award Recipients DOJ indicts suspected Wilmington Hospital shooter on multiple felony charges
 Military Families Can Visit Select Museums for Free this Summer as part of Blue Star Museums
 Delaware State Parks Kicks Off Virtual 5K Fundraiser to Celebrate 75th Anniversary
 Visit Delaware and 1440 Film Co. Win Telly Award for “Back of House” Video Series
 ADVISORY: State Leaders to Host Press Conference Launching Legislative Hall Period Product Drive
 Delaware SUN Bucks Available in June to Help Families Feed Children this Summer
 DNREC Offers Expanded Assistance for Farmers Due to Significantly Increased Reports of Deer Damage AG Jennings secures final victory over Trump Administration’s ban on offshore wind permitting Governor Meyer Calls for Immediate Action to Protect Delaware Ratepayers and Hold Utilities Accountable
 Governor Meyer and DSHA Announce Major Step Forward for Hope Center Expansion in Kent County
 DNREC Indian River Dredging Project Near Millsboro to Improve Boater Navigation, Restore Tidal Wetlands
 Delaware Brownfield Conference, Hosted by DNREC, to be Held Aug. 20 in Wilmington AG Jennings defeats Koch billionaire-backed effort to upend Delaware’s election transparency laws DOJ secures multiple convictions including Murder First in fatal Newark pedestrian collision DOJ indicts suspended Delmar officer on multiple counts of Official Misconduct, Unlawful Sexual Contact
 Gabriel Alfaro Reels in 10.1 Pounds of Fish to Win 40th Annual Delaware Youth Fishing Tournament
 Delaware Department of Human Resources Hosts Third Statewide Career Fair of 2026
 Delaware Public Archives Kicks Off Summer Spotlighting Delaware Beach Memories in New Digital Exhibit
 Delaware Division of the Arts Earns 20 Awards at 2026 Delaware Press Association Communications Contest
 Delaware’s Largest Class of 27 Individual Artist Fellows Headlines “Award Winners XXVI” DOJ secures major prison time for three Exit 4 members involved in the murder of Carrie Mondell and Khalil Ameer-Bey
 State and Thomas Jefferson University Partner to Establish Delaware’s First Medical School
Department of Education | Newsroom | Date Posted: Wednesday, June 19, 2019
Graduation rate up, dropout rate down for 2018
Delaware’s public high school graduation rate continues to increase, once again hitting a record high in 2018. The state’s dropout rate also declined.
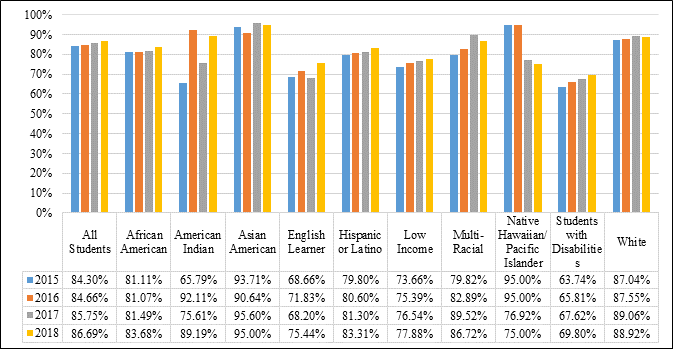
The annual Delaware Department of Education reports show an overall graduation rate of 86.69 percent in 2018, an increase from 85.75 percent in 2017. 2019 data will be available next year. The graduation rates for several student subgroups – African American, American Indian, Hispanic, low-income, English learners and students with disabilities – also are up from 2017.
The dropout rate saw a slight decrease – 699 of the 41,593 students enrolled in grades 9-12 dropped out for a rate of 1.68 percent, slightly down from the 2017 rate of 1.71 percent.
“Every day educators across our state are focused on the children most at risk for dropping out or not graduating on time. They are diligently working to target interventions and supports that meet their students’ needs. Delaware’s educators deserve credit for these improvements,” Secretary of Education Susan Bunting said. “We know our work is not done, and we will continue to focus on those students who need more support. We must ensure that every child completes his or her education.”
Graduation rate
The graduation rate tracks the percentage of 9th students who graduate with a regular high school diploma within four years.
While the annual dropout rate provides information about one particular school year and all students enrolled in high school in that year, the graduation rate provides information about a particular group of students followed over the course of high school. It looks at all students who started high school at the 9th grade and how many graduated within four years. For the 2018 data, that means students who started 9th grade in the 2014/15 school year.
The 2018 rate is the highest since the state changed how it calculates graduation rates in 2010-11.
Out of the 10,287 students in the Class of 2018, 8,918 students graduated with a regular diploma.
Not counted as graduates in the required formula are those students who earn certificates; 85 students from the Class of 2018 did so. Also not counted as graduates are those students who remain in school after their fourth year of graduation to continue their education. For the Class of 2018, 151 students remained in school.
For that reason, the state also looks at five- and six-year graduation rates. The graduation rate for the Class of 2016 was 84.66 percent at the end of four years, 85.63 percent at the end of five years and 85.79 percent at the end of six years.
Four-year graduation rate trend data, including subgroup and district/school information, is available in the report.
Four-Year Graduation Rates by Student Group
Class of 2015-2018
Dropout rate
The annual dropout rate is calculated from grades 9 to 12, as prescribed by the National Center for Educational Statistics (NCES), which provides data to the federal reporting system. The rate represents the total number of students (grades 9-12) who dropped out in a single year, divided by the total enrollment of the same school year. Data also is collected from private schools and families who homeschool their children. That information is only used to verify whether students transferred from public to private and home schools.
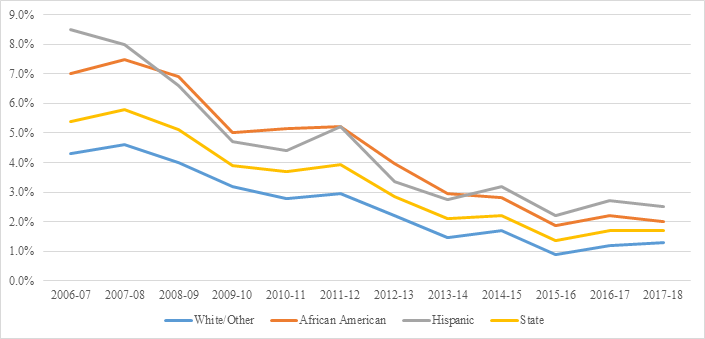
The annual report also looks at dropouts by student demographic. Statewide in the 2017-2018 school year, of the 699 who dropped out, 282 were white/other, 258 were African American and 159 were Hispanic. Looking at the total student enrollment by demographics for 2017-18, 2.5 percent of Hispanic, 2 percent of African American and 1.3 percent of white/other students dropped out.
The majority of the 699 dropouts were male (432). The largest number were enrolled in the 10th grade (215). Students cited academic, personal and economic reasons for why they left school.
The state report provides analysis based on demographics and geographic breakdowns, including by county and districts/charter schools. For 2017-18, New Castle had the lowest percentage of dropouts (1.5 percent). Kent County’s rate was 1.6 percent while Sussex’s rate was 2.2 percent. Find more details in the report.
Delaware Dropout Summary Statistics, 2006-2018
The reports will be presented to the State Board of Education on Thursday. Find the presentation slides here. Find more historical data here.
Media contact: Alison May, alison.may@doe.k12.de.us, 302-735-4006.
Keep up to date by receiving a daily digest email, around noon, of current news release posts from state agencies on news.delaware.gov.
Here you can subscribe to future news updates.
Department of Education | Newsroom | Date Posted: Wednesday, June 19, 2019
Graduation rate up, dropout rate down for 2018
Delaware’s public high school graduation rate continues to increase, once again hitting a record high in 2018. The state’s dropout rate also declined.
The annual Delaware Department of Education reports show an overall graduation rate of 86.69 percent in 2018, an increase from 85.75 percent in 2017. 2019 data will be available next year. The graduation rates for several student subgroups – African American, American Indian, Hispanic, low-income, English learners and students with disabilities – also are up from 2017.
The dropout rate saw a slight decrease – 699 of the 41,593 students enrolled in grades 9-12 dropped out for a rate of 1.68 percent, slightly down from the 2017 rate of 1.71 percent.
“Every day educators across our state are focused on the children most at risk for dropping out or not graduating on time. They are diligently working to target interventions and supports that meet their students’ needs. Delaware’s educators deserve credit for these improvements,” Secretary of Education Susan Bunting said. “We know our work is not done, and we will continue to focus on those students who need more support. We must ensure that every child completes his or her education.”
Graduation rate
The graduation rate tracks the percentage of 9th students who graduate with a regular high school diploma within four years.
While the annual dropout rate provides information about one particular school year and all students enrolled in high school in that year, the graduation rate provides information about a particular group of students followed over the course of high school. It looks at all students who started high school at the 9th grade and how many graduated within four years. For the 2018 data, that means students who started 9th grade in the 2014/15 school year.
The 2018 rate is the highest since the state changed how it calculates graduation rates in 2010-11.
Out of the 10,287 students in the Class of 2018, 8,918 students graduated with a regular diploma.
Not counted as graduates in the required formula are those students who earn certificates; 85 students from the Class of 2018 did so. Also not counted as graduates are those students who remain in school after their fourth year of graduation to continue their education. For the Class of 2018, 151 students remained in school.
For that reason, the state also looks at five- and six-year graduation rates. The graduation rate for the Class of 2016 was 84.66 percent at the end of four years, 85.63 percent at the end of five years and 85.79 percent at the end of six years.
Four-year graduation rate trend data, including subgroup and district/school information, is available in the report.
Four-Year Graduation Rates by Student Group
Class of 2015-2018
Dropout rate
The annual dropout rate is calculated from grades 9 to 12, as prescribed by the National Center for Educational Statistics (NCES), which provides data to the federal reporting system. The rate represents the total number of students (grades 9-12) who dropped out in a single year, divided by the total enrollment of the same school year. Data also is collected from private schools and families who homeschool their children. That information is only used to verify whether students transferred from public to private and home schools.
The annual report also looks at dropouts by student demographic. Statewide in the 2017-2018 school year, of the 699 who dropped out, 282 were white/other, 258 were African American and 159 were Hispanic. Looking at the total student enrollment by demographics for 2017-18, 2.5 percent of Hispanic, 2 percent of African American and 1.3 percent of white/other students dropped out.
The majority of the 699 dropouts were male (432). The largest number were enrolled in the 10th grade (215). Students cited academic, personal and economic reasons for why they left school.
The state report provides analysis based on demographics and geographic breakdowns, including by county and districts/charter schools. For 2017-18, New Castle had the lowest percentage of dropouts (1.5 percent). Kent County’s rate was 1.6 percent while Sussex’s rate was 2.2 percent. Find more details in the report.
Delaware Dropout Summary Statistics, 2006-2018
The reports will be presented to the State Board of Education on Thursday. Find the presentation slides here. Find more historical data here.
Media contact: Alison May, alison.may@doe.k12.de.us, 302-735-4006.
Keep up to date by receiving a daily digest email, around noon, of current news release posts from state agencies on news.delaware.gov.
Here you can subscribe to future news updates.
Delaware's Governor
State Agencies
Elected Officials
General Assembly
Delaware Courts
State Employees
Cities & Towns
Delaware State Code
State Regulations
Business First Steps
Phone Directory
Locations Directory
Public Meetings
Voting & Elections
Transparency
Delaware Marketplace
Tax Center
Personal Income Tax
Privacy Policy
Weather & Travel
Contact Us
Corporations
Franchise Tax
Gross Receipts Tax
Withholding Tax
Delaware Topics
Help Center
Mobile Apps
E-mail / Text Alerts
Social Media

Built by the Government Information Center
©MMXXVI Delaware.gov
