


2019 state assessment results released
Department of Education | Newsroom | Date Posted: Thursday, August 1, 2019

 DNREC to Accept Applications for 2027 Community Environmental Project Fund Grants Starting Aug. 1
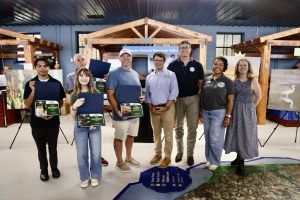
 Governor Matt Meyer, Agriculture Secretary Don Clifton honor America 250 Farms at Delaware State Fair
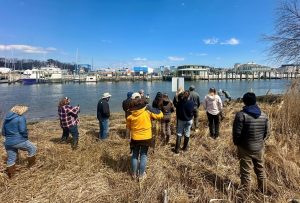 DNREC to Host Introduction to Living Shorelines Training on Sept. 22 and 23
 AG Jennings files lawsuit challenging unlawful conditions on federal counterterrorism funding
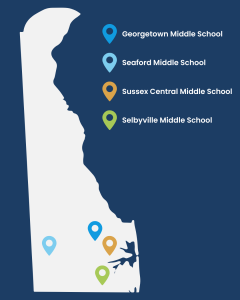 Governor Meyer Announces Funding to Establish Four New School-Based Health Centers in Sussex County AG Jennings obtains court order protecting Delaware consumers against pest control company
 DNREC Introduces Paddle Quest as Statewide Summer Kayak, Paddleboat and Canoe Challenge
 Delaware Adds New Services to Help People with Intellectual and Developmental Disabilities Live More Independently AG Jennings files lawsuit challenging Trump Administration rule that weakens regulation of highly potent greenhouse gas
 Apply today for DOC’s Fall 2026 Citizens Academy and get a look inside Delaware’s correctional system
 Division of Small Business Launches Office of Small Business Access, Announces Listening Tours in July and August
 Delaware State Fire Commission Announces Appointment of Matthew M. Dodds as Director of the Delaware State Fire School
 Governor Meyer Signs Landmark Health Care Affordability Package to Lower Costs and Protect Patients
 DPH Confirms Second Positive Measles Case and Encourages Unvaccinated Residents to Seek Vaccination Delaware Supreme Court upholds Attorney General’s hearing authority in landmark opinion
 DNREC Seeks Volunteers for 2026 Delaware Coastal Cleanup on Saturday, Sept. 19 Governor Meyer Signs Executive Order Strengthening Conflict-of-interest Standards for Unclaimed Property Task Force AG Jennings, Mayor Carney and Chief Campos release body-worn camera footage
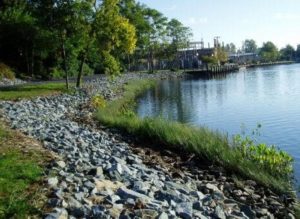 DNREC Soliciting Project Proposals For Surface Water Matching Planning Grants
 OHS Urges Riders and Drivers to Stay Alert Following Recent Motorcycle Crashes
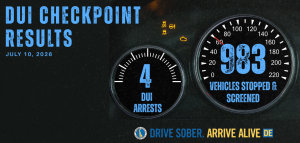 OHS Releases DUI Checkpoint Results, Reinforces Ongoing Efforts to Reduce Impaired Driving AG Jennings announces multistate settlement of bankruptcy claims against 23andMe over genetic data breach
 Governor Meyer Launches Delaware Commercial Corridor Initiative To Support Small Businesses
 Governor Meyer Orders the Lowering of Flags in Concurrence with White House
 Delaware Office of Highway Safety Sober Rides Program Helped More Than 900 Delawareans Get Home Safely Governor Meyer’s Statement on Traffic Stop in Dover, Pledges Full Investigation AG Jennings announces $45 million multistate settlement with Block Inc. over deceptive practices on Cash App
 Talk & Film Bring Delaware’s Revolutionary Story to Life at Archives’ First Saturday Program Governor Meyer Vetoes $35 Million Legislative Hall Expansion Amid Affordability Concerns
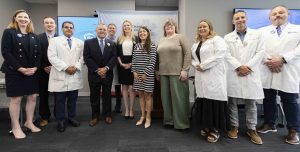 Delaware Hospitals Adopt Statewide Emergency Department Guidance for Opioid Use Disorder Treatment
 Gov. Meyer Signs Banking Modernization Package to Strengthen Delaware’s Leadership in Financial Services
 Newly Launched Initiative Strengthens Delaware’s Health Information Technology Infrastructure Attorney General Jennings announces two major victories striking down executive orders on elections
 Delaware’s 153rd General Assembly Advances DHSS Priorities to Lower Costs, Strengthen Care Workforce Gov. Meyer Signs FY2027 Budget Investing in Education, Affordability, and Opportunity
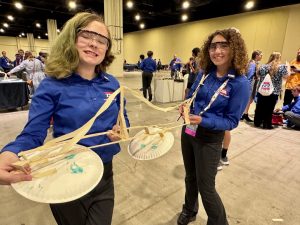 Delaware students earn national STEM recognition through Career and Technical Education
 Delaware students earn national recognition while building the future of healthcare
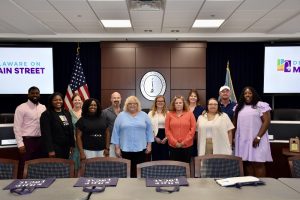 Delaware on Main Street Program Grows as 17 Communities Earn National Designations Gov. Meyer Calls Upon Delaware Public Service Commission to Suspend Delmarva Rate Hike
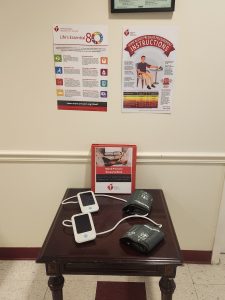 DSHA, American Heart Association to provide blood pressure monitoring devices in public housing communities
 Dozens of Incarcerated Students Earn High School Diplomas as Academic Year Closes DOJ secures 59-year sentence for Wilmington man who caused fatal collision that claimed two lives, injured four others DOJ announces sentence for final Exit 4 member associated with four-year crime spree
 National Grant Initiative Invests in Delaware’s Indigenous and Cuban Cultural Traditions
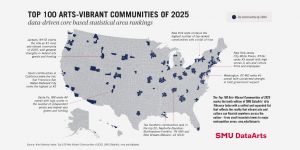 Delaware and Wilmington Named Among Nation’s Most Arts-Vibrant by SMU DataArts
Department of Education | Newsroom | Date Posted: Thursday, August 1, 2019
The Delaware Department of Education on Thursday released the 2019 statewide student assessment results.
Statewide, 53 percent of students in grades 3 to 8 scored at the proficient level or higher this year in the Smarter English language arts (ELA) assessment, compared to 54 percent in 2018. For mathematics, 44 percent of students in grades 3 to 8 scored at the proficient level or higher, no change from the 2018 results. At the high school level, students took the SAT with the results relatively unchanged.
Because Delaware transitioned this year to new science and social studies assessments, state officials will spend the fall setting cut scores to determine which scores are proficient on the new tests. Results will be released this winter. Results for the state’s alternate assessment, administered to those students with significant cognitive disabilities, were released today as well. Those results also were relatively unchanged.
Educators already received their students’ scores — Smarter results, for example, are available to teachers three weeks after their students complete the test. Families will receive score reports with their children’s results via U.S. mail beginning next week. Family guides and other resources also are available online.
For more information on state assessment results, visit the Delaware Report Card site and see the 2019 assessment presentation.
Smarter Assessment (ELA/mathematics)
Nationwide, states administering the Smarter assessment have seen similar trends to Delaware – slow growth at the state level with larger gains at some school levels.
Delaware did see slight gains in some subgroups statewide between 2018 and 2019, with English learners and students with disabilities averages increasing by one percentage point each in ELA and one percentage point in math for both students with disabilities and Hispanic students.
Secretary of Education Susan Bunting thanked students and educators for their hard work. She also committed to continue to provide supports from the state.
“We must focus our time and resources on promoting early diagnosis and intervention, using a range of assessments throughout the year and training educators on how to use the data available to them to effect change in curriculum and instruction,” she said. “We also must provide technical assistance and other support to our schools and districts as they select local curricula so all children have access to high quality materials and assessments.”
Bunting also pointed to bright spots across the state, such as in Seaford School District, which has seen steady growth in both ELA and mathematics scores since 2015, the first year the state administered the Smarter assessment. For ELA, 56 percent of students scored at the proficient level or higher, above the state average and up 2 percentage points from last year. In 2015, only 38 percent of Seaford students were proficient. Math scores also are continuing to climb: This year 48 percent of students scored at proficient or higher, above the state average and 2 percentage points higher than in 2018. It is a 20-point gain from 2015.
Seaford’s Frederick Douglass Elementary particularly has shown strong growth. For ELA, 42 percent of students were proficient in 2015. The number has consistently improved since then, reaching 67 percent of students this year. In 2015, only 7 percent of the school’s English learners were proficient in ELA; 60 percent were this year. Other subgroups also showed strong ELA growth: the percent proficient went from 39 percent to 64 percent for low-income students, and 7 percent to 47 percent for students with disabilities.
Douglass’ math scores also have increased steadily, moving from 35 percent to 69 percent for all students between 2015 and 2019. English learner scores went from 7 percent to 70 percent proficient, students with disabilities went from 14 percent to 41 percent, low-income went from 30 percent to 66 percent, and Hispanic students went from 37 to 76 percent.
“When asked to explain our success we are able to point to simple addition,” Seaford Superintendent David Perrington said. “The district has worked hard at bringing together a number of dynamics that are essential for student achievement. These include a supportive school board, a vision-driven district office staff, a strong building leadership, a committed teaching staff, an engaged student body, and a caring school community.
“At the beginning of the school year we discussed the concept ‘Push Don’t Pity.’ This model is grounded in the belief of high expectations for all students,” he said. “It requires us as educators to accept the responsibility of each student’s learning experience and each student to believe they have the capacity to succeed. When added successfully together we have a sum of increasing student achievement.”
Lake Forest also saw some strong gains, particularly among subgroups in mathematics in several of its elementary schools. Lake Forest East, for example, saw gains between 2018 and 2019 of 39 percentage points for Hispanic students, 39 percentage points for English learners, 20 percentage points for low-income students and 14 percentage points for African American students. The gain was 12 percentage points for all students.
At Lake Forest North, the 2018 to 2019 scores show gains of 23 percentage points for low-income students, 17 percentage points for English learners, 8 percentage points for African American students, 7 percentage points for Hispanic students and 4 percentage points for all students.
“The Lake Forest School District attributes our success to using the standards to refine curriculum and lesson plans, analyzing formative and summative data during professional learning communities and staff development days and providing time for teacher collaboration throughout the year,” Superintendent Brenda Wynder said. “We are proud of our teachers’ willingness to strive for student achievement and continuous improvement in our data. It has taken our entire ‘village’ to achieve this success.”
Bunting also spotlighted several other schools that have shown strong growth for subgroups and students overall.
SAT
Delaware’s high school federal accountability test is the SAT, typically taken in 11th grade. Statewide 48 percent of students scored at the proficient level or higher in 2019 on the evidence-based reading and writing (ERW) portion, down 2 percentage points from 2018. In math, 28 percent of students did so, the same percentage as in 2018. For the essay portion of the exam, 42 percent of students scored at proficient or higher, down from 44 percent in 2018.
For math, Indian River School District saw gains. Indian River High School had 35 percent of students scoring at the proficient level or higher in 2019, up from 29 percent in 2018 and 32 percent in 2017. Sussex Central High School had 22 percent in 2019, up from 19 percent in 2018 and 21 percent in 2017. Colonial School District’s William Penn High School also has seen steady growth: 15 percent in 2019, up from 13 percent in 2018 and 10 percent in 2017.
Alternate assessment
This is the second year of administration for Delaware’s alternate assessment. The percentage of students scoring proficient is down in all three subject areas (ELA, math and science) from last year’s initial administration. The 2019 state average for ELA was 28 percent proficient, down from 32 percent in 2018; math was 15 percent in 2019, down from 17 percent in 2018; and science was 17 percent in 2019, down from 19 percent in 2018.
Media Contact: Alison May, alison.may@doe.k12.de.us, 302-735-4006
Keep up to date by receiving a daily digest email, around noon, of current news release posts from state agencies on news.delaware.gov.
Here you can subscribe to future news updates.
Delaware's Governor
State Agencies
Elected Officials
General Assembly
Delaware Courts
State Employees
Cities & Towns
Delaware State Code
State Regulations
Business First Steps
Phone Directory
Locations Directory
Public Meetings
Voting & Elections
Transparency
Delaware Marketplace
Tax Center
Personal Income Tax
Privacy Policy
Weather & Travel
Contact Us
Corporations
Franchise Tax
Gross Receipts Tax
Withholding Tax
Delaware Topics
Help Center
Mobile Apps
E-mail / Text Alerts
Social Media

Built by the Government Information Center
©MMXXVI Delaware.gov
